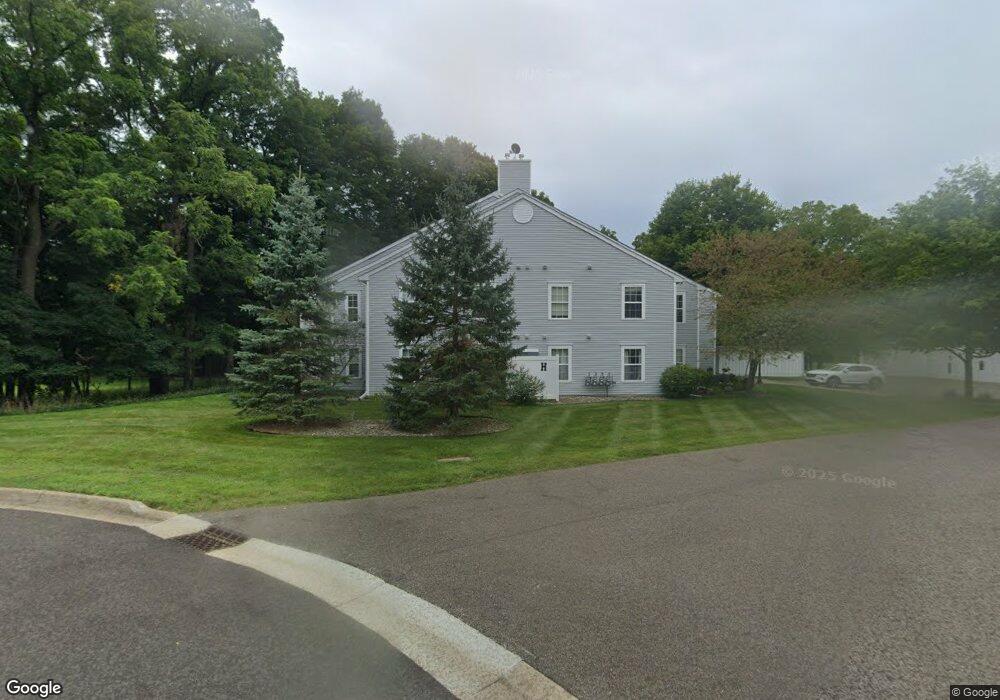
393 Boyer Ct Unit 68 Marshall, MI 49068
Estimated Value: $162,964 - $230,000
2
Beds
2
Baths
1,079
Sq Ft
$176/Sq Ft
Est. Value
About This Home
This home is located at 393 Boyer Ct Unit 68, Marshall, MI 49068 and is currently estimated at $189,991, approximately $176 per square foot. 393 Boyer Ct Unit 68 is a home located in Calhoun County with nearby schools including Harrington Elementary School, Marshall High School, and Marshall Academy.
Ownership History
Date
Name
Owned For
Owner Type
Purchase Details
Closed on
Nov 10, 2016
Sold by
Casterline Cathy L
Bought by
Casterline Cathy L and Casterline Revocable T Cathy L
Current Estimated Value
Purchase Details
Closed on
May 14, 2013
Sold by
Kime Ramona S and Graessie Ramona Kime
Bought by
Casterline Cathy L
Home Financials for this Owner
Home Financials are based on the most recent Mortgage that was taken out on this home.
Original Mortgage
$78,850
Outstanding Balance
$55,622
Interest Rate
3.38%
Mortgage Type
New Conventional
Estimated Equity
$134,369
Purchase Details
Closed on
Sep 16, 2004
Sold by
Murari Thirumalai A and Uppiliappan Rathika
Bought by
Graessie Ramona Kime
Purchase Details
Closed on
Jul 17, 1997
Bought by
Murari Thirumalai A
Create a Home Valuation Report for This Property
The Home Valuation Report is an in-depth analysis detailing your home's value as well as a comparison with similar homes in the area
Home Values in the Area
Average Home Value in this Area
Purchase History
| Date | Buyer | Sale Price | Title Company |
|---|---|---|---|
| Casterline Cathy L | -- | Attorney | |
| Casterline Cathy L | $83,000 | Dba Ppr Title Agency | |
| Graessie Ramona Kime | $88,000 | -- | |
| Murari Thirumalai A | $72,100 | -- |
Source: Public Records
Mortgage History
| Date | Status | Borrower | Loan Amount |
|---|---|---|---|
| Open | Casterline Cathy L | $78,850 |
Source: Public Records
Tax History
| Year | Tax Paid | Tax Assessment Tax Assessment Total Assessment is a certain percentage of the fair market value that is determined by local assessors to be the total taxable value of land and additions on the property. | Land | Improvement |
|---|---|---|---|---|
| 2025 | $2,818 | $82,400 | $0 | $0 |
| 2024 | $554 | $74,500 | $0 | $0 |
| 2023 | $2,528 | $67,800 | $0 | $0 |
| 2022 | $2,022 | $58,700 | $0 | $0 |
| 2021 | $2,451 | $50,500 | $0 | $0 |
| 2020 | $2,318 | $51,700 | $0 | $0 |
| 2019 | $0 | $48,600 | $0 | $0 |
| 2018 | $0 | $45,900 | $11,700 | $34,200 |
| 2017 | $0 | $44,200 | $0 | $0 |
| 2016 | $0 | $41,800 | $0 | $0 |
| 2015 | -- | $41,200 | $0 | $0 |
| 2014 | -- | $40,000 | $0 | $0 |
Source: Public Records
Map
Nearby Homes
- 212 Chauncey Ct Unit 39
- 606 Birch St
- 127 Eastman Ct Unit 68
- 631 N Linden St
- 635 N Linden St
- 345 N Mulberry St
- 208 W Prospect St
- 320 N Division St
- 432 High St
- 222 N Eagle St
- 210 N Kalamazoo Ave
- 219 N Sycamore St
- 605 Turquoise Trail
- 339 N Marshall Ave
- 752 Wright Ln
- 346 N Marshall Ave
- 109 S Mulberry St
- 126 W Hanover St
- 319 Ferguson Rd
- 619 E Michigan Ave
- 393 Boyer Ct Unit H
- 395 Boyer Ct
- 391 Boyer Ct
- 391 Boyer Ct Unit 67
- 397 Boyer Ct Unit 70
- 389 Boyer Ct Unit 66
- 387 Boyer Ct
- 385 Boyer Ct
- 383 Boyer Ct
- 352 Boyer Ct
- 354 Boyer Ct Unit 54
- 356 Boyer Ct Unit 55
- 358 Boyer Ct
- 360 Boyer Ct Unit 57
- 362 Boyer Ct Unit 58
- 364 Boyer Ct Unit 59
- 366 Boyer Ct Unit 60
- 368 Boyer Ct
- 370 Boyer Ct
- 370 Boyer Ct Unit G
Your Personal Tour Guide
Ask me questions while you tour the home.