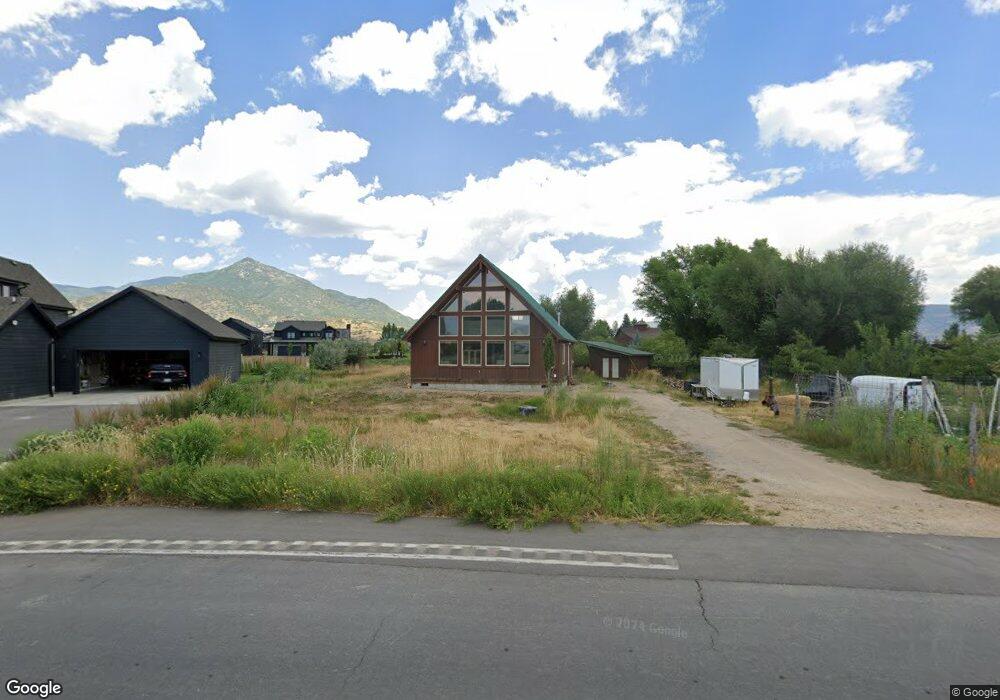
393 E 300 N Midway, UT 84049
Estimated Value: $733,143 - $915,000
Studio
--
Bath
1,640
Sq Ft
$509/Sq Ft
Est. Value
About This Home
This home is located at 393 E 300 N, Midway, UT 84049 and is currently estimated at $834,786, approximately $509 per square foot. 393 E 300 N is a home with nearby schools including Midway Elementary School, Rocky Mountain Middle School, and Wasatch High School.
Ownership History
Date
Name
Owned For
Owner Type
Purchase Details
Closed on
Oct 29, 2015
Sold by
Lott Donald Joseph and Lott Patricia Dillon
Bought by
Hart Bradley J and Hart Alison L
Current Estimated Value
Home Financials for this Owner
Home Financials are based on the most recent Mortgage that was taken out on this home.
Original Mortgage
$256,000
Outstanding Balance
$201,902
Interest Rate
3.87%
Mortgage Type
New Conventional
Estimated Equity
$632,884
Purchase Details
Closed on
Oct 17, 2011
Sold by
Lott Patricia D and Lott Donald J
Bought by
Lott Donald Joseph and Lott Patricia Dillon
Purchase Details
Closed on
Aug 23, 2005
Sold by
Snow Patricia D
Bought by
Lott Patricia D and Lott Donald J
Home Financials for this Owner
Home Financials are based on the most recent Mortgage that was taken out on this home.
Original Mortgage
$45,000
Interest Rate
5.61%
Mortgage Type
New Conventional
Create a Home Valuation Report for This Property
The Home Valuation Report is an in-depth analysis detailing your home's value as well as a comparison with similar homes in the area
Home Values in the Area
Average Home Value in this Area
Purchase History
| Date | Buyer | Sale Price | Title Company |
|---|---|---|---|
| Hart Bradley J | -- | Summit Escrow & Title | |
| Lott Donald Joseph | -- | Atlas Title Insurance Heber | |
| Lott Patricia D | -- | Founders Title Company Heber |
Source: Public Records
Mortgage History
| Date | Status | Borrower | Loan Amount |
|---|---|---|---|
| Open | Hart Bradley J | $256,000 | |
| Previous Owner | Lott Patricia D | $45,000 |
Source: Public Records
Tax History
| Year | Tax Paid | Tax Assessment Tax Assessment Total Assessment is a certain percentage of the fair market value that is determined by local assessors to be the total taxable value of land and additions on the property. | Land | Improvement |
|---|---|---|---|---|
| 2025 | $2,686 | $530,000 | $300,000 | $230,000 |
| 2024 | $2,656 | $530,000 | $300,000 | $230,000 |
| 2023 | $2,656 | $545,200 | $250,000 | $295,200 |
| 2022 | $3,007 | $545,200 | $250,000 | $295,200 |
| 2021 | $1,865 | $261,411 | $125,000 | $136,411 |
| 2020 | $1,924 | $261,411 | $125,000 | $136,411 |
| 2019 | $1,760 | $143,776 | $0 | $0 |
| 2018 | $1,760 | $143,776 | $0 | $0 |
| 2017 | $1,657 | $134,562 | $0 | $0 |
| 2016 | $1,608 | $127,412 | $0 | $0 |
| 2015 | $1,528 | $127,412 | $0 | $0 |
| 2014 | $2,891 | $231,659 | $112,000 | $119,659 |
Source: Public Records
Map
Nearby Homes
- 215 E 300 N
- 296 E 230 N
- 221 E Rockwell Way
- 358 N Whitaker Farm Way
- 431 N Farmhouse Way
- 48 Dairy Ln
- 802 E Stone Barn Ln
- 80 E 100 N
- 64 S 450 E
- 103 E Main St
- 762 N Wellness Dr
- 715 Sunflower Ln
- 623 N Center St
- 141 S 180 E
- 115 S 100 E
- 115 S 100 E Unit 4
- 215 S 300 E
- 752 N Wellness Dr Unit 25
- 70 Geneva Dr
- 176 Geneva Dr
Your Personal Tour Guide
Ask me questions while you tour the home.