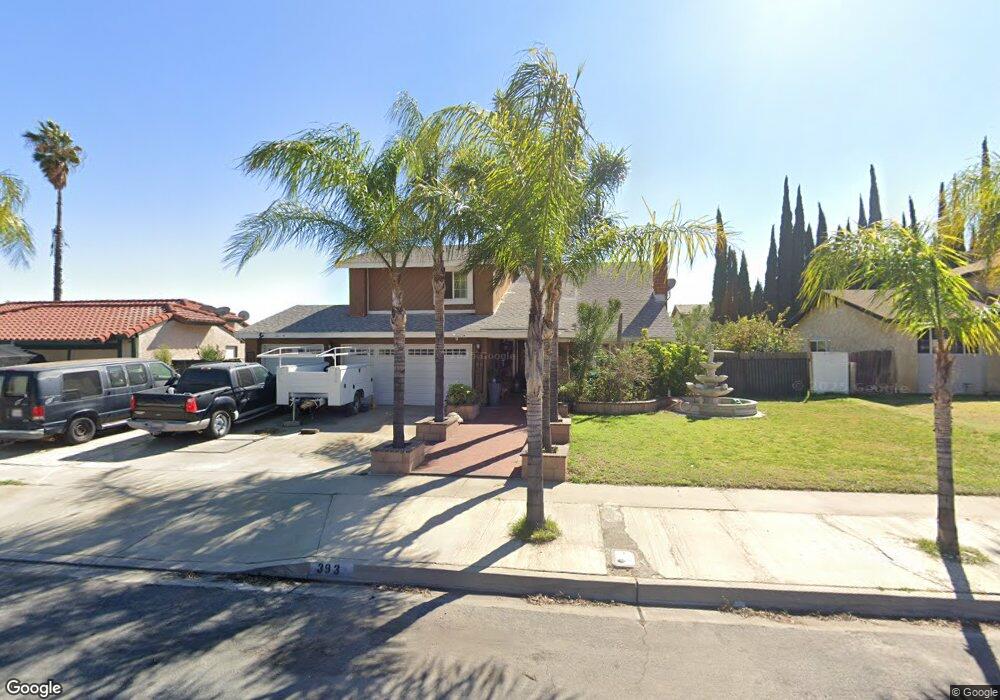
393 E Chaparral St Rialto, CA 92376
Estimated Value: $588,000 - $618,000
4
Beds
3
Baths
1,784
Sq Ft
$337/Sq Ft
Est. Value
About This Home
This home is located at 393 E Chaparral St, Rialto, CA 92376 and is currently estimated at $600,706, approximately $336 per square foot. 393 E Chaparral St is a home located in San Bernardino County with nearby schools including Morgan Elementary School, Frisbie Middle School, and Wilmer Amina Carter High School.
Ownership History
Date
Name
Owned For
Owner Type
Purchase Details
Closed on
Dec 1, 2025
Sold by
Osuna Maria Del Rosario and Contreras David Rodrigues
Bought by
Rodriguez Family Revocable Living Trust and Contreras
Current Estimated Value
Purchase Details
Closed on
Jan 14, 2009
Sold by
Contreras David Rodriguez and Osuna Maria De Rosario
Bought by
Contreras David Rodriguez and Osuna Maria Del Rosario
Home Financials for this Owner
Home Financials are based on the most recent Mortgage that was taken out on this home.
Original Mortgage
$176,000
Interest Rate
5.49%
Mortgage Type
New Conventional
Purchase Details
Closed on
Apr 23, 1999
Sold by
Lasalle National Bank
Bought by
Contreras David Rodriguez and Osuna Maria Del Rosario
Home Financials for this Owner
Home Financials are based on the most recent Mortgage that was taken out on this home.
Original Mortgage
$119,915
Interest Rate
6.86%
Mortgage Type
FHA
Purchase Details
Closed on
Nov 30, 1998
Sold by
Mesa Robert S and Mesa Eleanor I
Bought by
Nomura Asset Securities Corp
Purchase Details
Closed on
Jan 23, 1996
Sold by
Unger Lyla K
Bought by
Unger Gerald
Create a Home Valuation Report for This Property
The Home Valuation Report is an in-depth analysis detailing your home's value as well as a comparison with similar homes in the area
Home Values in the Area
Average Home Value in this Area
Purchase History
We collect this data history from publicly available records. To have your information removed, we recommend requesting removal directly through your county’s website.
| Date | Buyer | Sale Price | Title Company |
|---|---|---|---|
| Rodriguez Family Revocable Living Trust | -- | None Listed On Document | |
| Contreras David Rodriguez | -- | North American Title | |
| Contreras David Rodriguez | $120,500 | Orange Coast Title | |
| Nomura Asset Securities Corp | $118,225 | Benefit Land Title Ins Co | |
| Unger Gerald | -- | -- |
Source: Public Records
Mortgage History
We collect this data history from publicly available records. To have your information removed, we recommend requesting removal directly through your county’s website.
| Date | Status | Borrower | Loan Amount |
|---|---|---|---|
| Previous Owner | Contreras David Rodriguez | $176,000 | |
| Previous Owner | Contreras David Rodriguez | $119,915 |
Source: Public Records
Tax History
| Year | Tax Paid | Tax Assessment Tax Assessment Total Assessment is a certain percentage of the fair market value that is determined by local assessors to be the total taxable value of land and additions on the property. | Land | Improvement |
|---|---|---|---|---|
| 2025 | $2,775 | $194,599 | $54,137 | $140,462 |
| 2024 | $2,668 | $190,783 | $53,075 | $137,708 |
| 2023 | $2,817 | $187,042 | $52,034 | $135,008 |
| 2022 | $2,606 | $183,375 | $51,014 | $132,361 |
| 2021 | $2,590 | $179,780 | $50,014 | $129,766 |
| 2020 | $2,594 | $177,936 | $49,501 | $128,435 |
| 2019 | $2,541 | $174,447 | $48,530 | $125,917 |
| 2018 | $2,454 | $171,026 | $47,578 | $123,448 |
| 2017 | $2,436 | $167,672 | $46,645 | $121,027 |
| 2016 | $2,072 | $164,384 | $45,730 | $118,654 |
| 2015 | $2,080 | $161,915 | $45,043 | $116,872 |
| 2014 | $1,955 | $158,744 | $44,161 | $114,583 |
Source: Public Records
Map
Nearby Homes
- 174 W Walnut Ave Unit B
- 220 W Walnut Ave Unit B
- 160 W Cascade Dr
- 1455 N Alice Ave
- 1839 N Millard Ave
- 360 Elizabeth Ct
- 1375 N Chestnut Ave
- 822 E Virginia St
- 1730 N Vista Ave
- 1445 N Pepper Ave
- 1252 N Mulberry Ave
- 2435 Gunner Ridge Way
- 2433 Gunner Ridge Way
- 2431 Gunner Ridge Way
- 411 E Jackson St
- 461 W Scott St
- 2448 Powell Dr
- 2414 Crater Ave
- 1015 N Joyce Ave
- 6019 Magnolia Ave
- 405 E Chaparral St
- 365 E Chaparral St
- 376 Lomita Dr
- 390 Lomita Dr
- 1829 N Sage Ave
- 419 E Chaparral St
- 351 E Chaparral St
- 362 Lomita Dr
- 1820 N Sage Ave
- 1820 N Marcella Ave
- 0 N 0 Lomita Dr Ave Unit WS13245894
- 1841 N Sage Ave
- 431 E Chaparral St
- 339 E Chaparral St
- 1834 N Sage Ave
- 1829 N Oakdale Ave
- 346 Lomita Dr
- 1834 N Marcella Ave
- 1765 N Sage Ave
- 1776 N Sage Ave
Your Personal Tour Guide
Ask me questions while you tour the home.