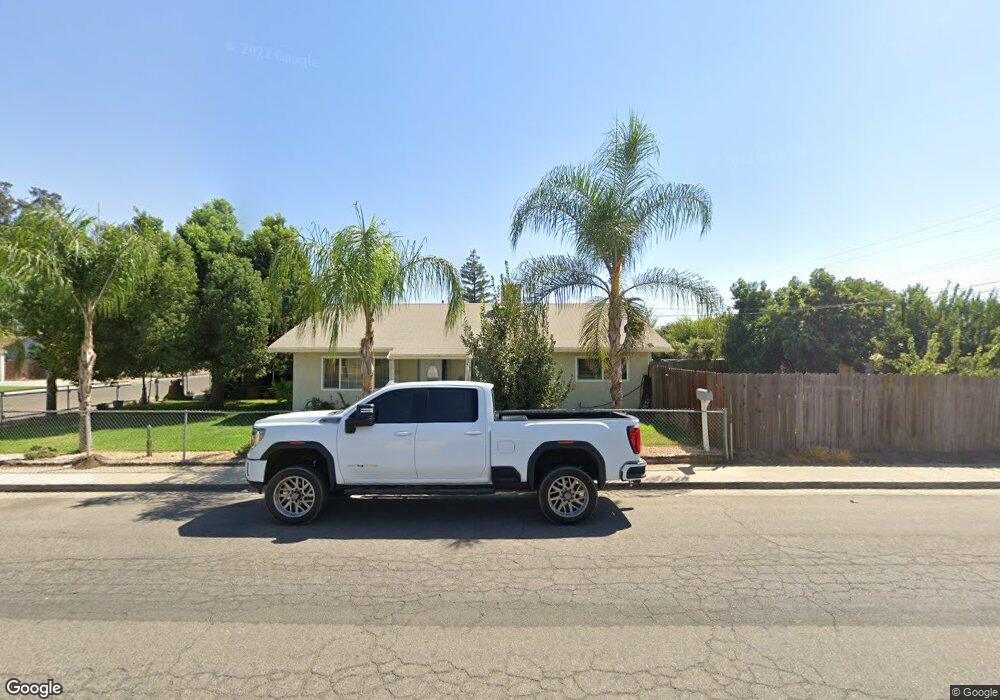
393 E Front St Farmersville, CA 93223
Estimated Value: $286,790 - $334,000
4
Beds
2
Baths
1,440
Sq Ft
$210/Sq Ft
Est. Value
About This Home
This home is located at 393 E Front St, Farmersville, CA 93223 and is currently estimated at $302,948, approximately $210 per square foot. 393 E Front St is a home located in Tulare County with nearby schools including J.E. Hester Elementary School, Freedom Elementary School, and George L. Snowden Elementary School.
Ownership History
Date
Name
Owned For
Owner Type
Purchase Details
Closed on
May 2, 2019
Sold by
Robledo Zenon
Bought by
Cortez Moya Maria L
Current Estimated Value
Home Financials for this Owner
Home Financials are based on the most recent Mortgage that was taken out on this home.
Original Mortgage
$65,000
Outstanding Balance
$49,944
Interest Rate
4.2%
Mortgage Type
New Conventional
Estimated Equity
$253,004
Purchase Details
Closed on
Mar 4, 1996
Sold by
Hud
Bought by
Cortez Leticia and Ramirez Hildardo
Home Financials for this Owner
Home Financials are based on the most recent Mortgage that was taken out on this home.
Original Mortgage
$68,931
Interest Rate
6.98%
Mortgage Type
FHA
Purchase Details
Closed on
Jul 21, 1995
Sold by
Platte Valley Funding Lp
Bought by
Hud
Purchase Details
Closed on
Jul 14, 1995
Sold by
Mcgill Ronald G
Bought by
Platte Valley Funding Lp
Create a Home Valuation Report for This Property
The Home Valuation Report is an in-depth analysis detailing your home's value as well as a comparison with similar homes in the area
Home Values in the Area
Average Home Value in this Area
Purchase History
| Date | Buyer | Sale Price | Title Company |
|---|---|---|---|
| Cortez Moya Maria L | -- | First American Title Company | |
| Cortez Leticia | $69,500 | North American Title Co | |
| Hud | -- | Fidelity National Title | |
| Platte Valley Funding Lp | $56,470 | Fidelity National Title Ins |
Source: Public Records
Mortgage History
| Date | Status | Borrower | Loan Amount |
|---|---|---|---|
| Open | Cortez Moya Maria L | $65,000 | |
| Closed | Cortez Leticia | $68,931 |
Source: Public Records
Tax History Compared to Growth
Tax History
| Year | Tax Paid | Tax Assessment Tax Assessment Total Assessment is a certain percentage of the fair market value that is determined by local assessors to be the total taxable value of land and additions on the property. | Land | Improvement |
|---|---|---|---|---|
| 2025 | $1,239 | $119,636 | $29,898 | $89,738 |
| 2024 | $1,239 | $117,291 | $29,312 | $87,979 |
| 2023 | $1,240 | $114,992 | $28,738 | $86,254 |
| 2022 | $1,147 | $112,738 | $28,175 | $84,563 |
| 2021 | $1,124 | $110,528 | $27,623 | $82,905 |
| 2020 | $1,111 | $109,395 | $27,340 | $82,055 |
| 2019 | $1,123 | $107,250 | $26,804 | $80,446 |
| 2018 | $2,274 | $105,147 | $26,278 | $78,869 |
| 2017 | $1,101 | $103,086 | $25,763 | $77,323 |
| 2016 | $1,037 | $101,065 | $25,258 | $75,807 |
| 2015 | $989 | $99,547 | $24,879 | $74,668 |
| 2014 | $989 | $97,597 | $24,392 | $73,205 |
Source: Public Records
Map
Nearby Homes
- 896 Farmersville Rd
- 0 S Farmersville Blvd Unit 238390
- 701 Farmersville Rd
- 322 E Citrus Dr
- 438 N Magnolia Ave
- 885 E Ash St
- 903 E Ash St
- 680 E Larry St
- 732 N Dwight Ave
- 738 E Larry St
- 753 N Brundage Ave
- 209 S Magnolia Ave
- 0 Avenue 288
- 1643 Tehama Ave
- 327 S Farmersville Blvd
- 0 Avenue 288
- 528 S Camelia Ave
- 896 N Mariposa Ave
- 245 W Oakland St
- 391 Teddy St
- 819 N Rose Ave
- 846 N Camelia Ave
- 380 E Front St
- 808 N Camelia Ave
- 793 N Rose Ave
- 362 E Front St
- 792 N Camelia Ave
- 844 N Rose Ave
- 775 N Rose Ave
- 810 N Rose Ave
- 790 N Rose Ave
- 768 N Camelia Ave
- 757 N Rose Ave
- 289 E Front St
- 774 N Rose Ave
- 480 E Front St
- 760 N Camelia Ave
- 823 N Camelia Ave
- 737 N Rose Ave
- 756 N Rose Ave