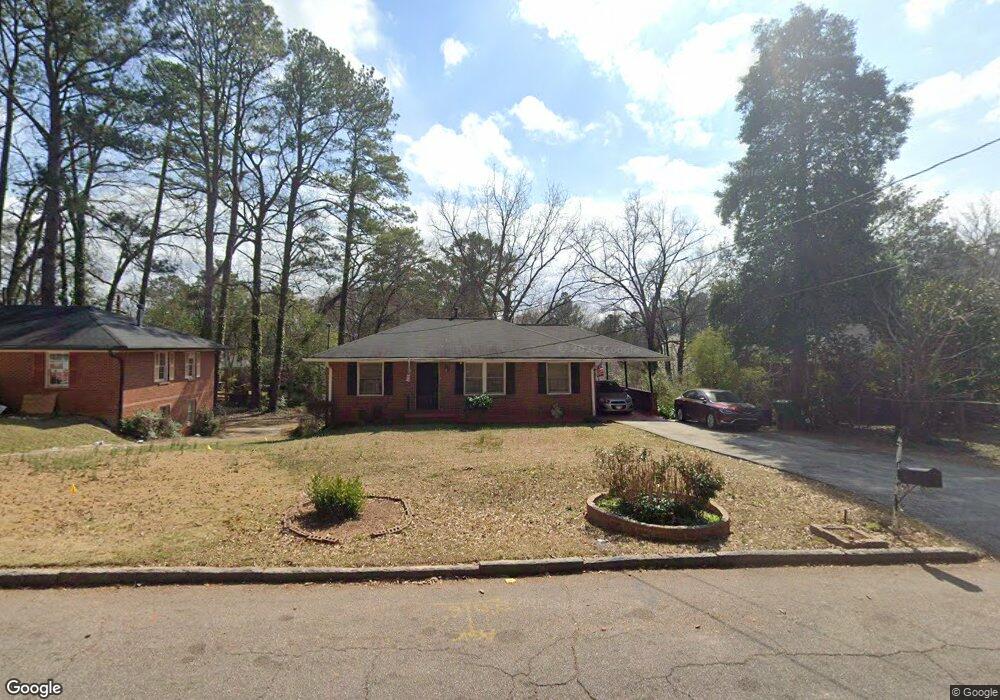
393 Lindsey Dr SE Atlanta, GA 30315
Lakewood NeighborhoodEstimated Value: $178,725 - $217,000
2
Beds
1
Bath
988
Sq Ft
$195/Sq Ft
Est. Value
About This Home
This home is located at 393 Lindsey Dr SE, Atlanta, GA 30315 and is currently estimated at $192,931, approximately $195 per square foot. 393 Lindsey Dr SE is a home located in Fulton County with nearby schools including Dobbs Elementary School, Long Middle School, and South Atlanta High School.
Ownership History
Date
Name
Owned For
Owner Type
Purchase Details
Closed on
Jul 20, 2012
Sold by
Tiller Albert Lee
Bought by
Smith Gail Elaine
Current Estimated Value
Purchase Details
Closed on
Mar 11, 1999
Sold by
Thomas Cathy R
Bought by
Watson Gail E
Home Financials for this Owner
Home Financials are based on the most recent Mortgage that was taken out on this home.
Original Mortgage
$64,800
Interest Rate
6.74%
Mortgage Type
New Conventional
Create a Home Valuation Report for This Property
The Home Valuation Report is an in-depth analysis detailing your home's value as well as a comparison with similar homes in the area
Home Values in the Area
Average Home Value in this Area
Purchase History
| Date | Buyer | Sale Price | Title Company |
|---|---|---|---|
| Smith Gail Elaine | -- | -- | |
| Watson Gail E | -- | -- |
Source: Public Records
Mortgage History
| Date | Status | Borrower | Loan Amount |
|---|---|---|---|
| Previous Owner | Watson Gail E | $64,800 |
Source: Public Records
Tax History Compared to Growth
Tax History
| Year | Tax Paid | Tax Assessment Tax Assessment Total Assessment is a certain percentage of the fair market value that is determined by local assessors to be the total taxable value of land and additions on the property. | Land | Improvement |
|---|---|---|---|---|
| 2025 | $2,575 | $56,720 | $21,120 | $35,600 |
| 2023 | $3,342 | $80,720 | $45,240 | $35,480 |
| 2022 | $2,428 | $60,000 | $23,840 | $36,160 |
| 2021 | $1,269 | $31,320 | $9,200 | $22,120 |
| 2020 | $1,268 | $30,960 | $9,080 | $21,880 |
| 2019 | $491 | $23,120 | $8,680 | $14,440 |
| 2018 | $489 | $11,800 | $2,760 | $9,040 |
| 2017 | $475 | $11,000 | $2,160 | $8,840 |
| 2016 | $476 | $11,000 | $2,160 | $8,840 |
| 2015 | $969 | $11,000 | $2,160 | $8,840 |
| 2014 | $499 | $11,000 | $2,160 | $8,840 |
Source: Public Records
Map
Nearby Homes
- 2276 Sargent Place SE
- 2209 Browns Mill Rd SE
- 2210 Rhinehill Rd SE
- 2203 Browns Mill Rd SE
- 322 E Rhinehill Rd SE
- 2168 Rhinehill Rd SE
- 388 Sargent Dr SE
- 444 Sargent Dr SE
- 319 E Rhinehill Rd SE
- 2214 Meador Ave SE
- 2197 Jernigan Dr SE
- 309 E Rhinehill Rd SE
- 2143 Rhinehill Rd SE
- 2242 Jernigan Dr SE
- 2205 Meador Ave SE
- 2318 Browns Mill Rd SE
- 2155 Meador Ave SE
- 2131 Meador Ave SE
- 399 Lindsey Dr SE
- 387 Lindsey Dr SE
- 392 Carey Dr SE
- 407 Lindsey Dr SE
- 400 Carey Dr SE
- 392 Lindsey Dr SE
- 396 Lindsey Dr SE
- 386 Lindsey Dr SE
- 400 Lindsey Dr SE
- 406 Carey Dr SE
- 415 Lindsey Dr SE
- 406 Lindsey Dr SE
- 2197 Sargent Place SE
- 2205 Sargent Place SE
- 412 Carey Dr SE
- 2191 Sargent Place SE
- 2209 Sargent Place SE
- 2185 Sargent Place SE
- 414 Lindsey Dr SE
- 423 Lindsey Dr SE