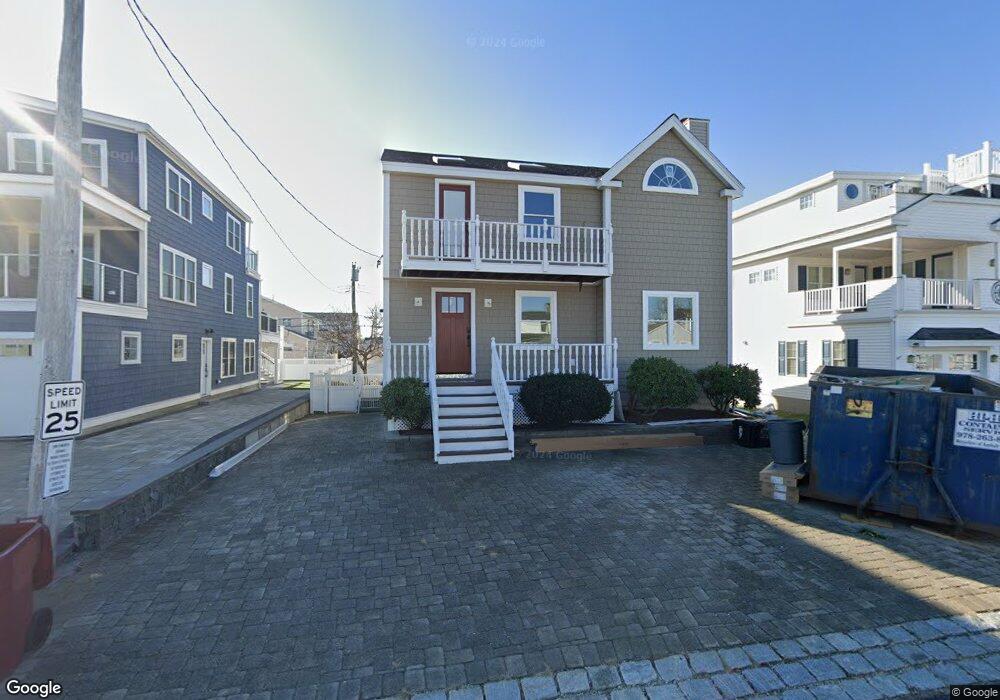
393 Plymouth St Seabrook, NH 03874
Seabrook Beach NeighborhoodEstimated Value: $1,206,441 - $1,761,000
4
Beds
3
Baths
2,670
Sq Ft
$519/Sq Ft
Est. Value
About This Home
This home is located at 393 Plymouth St, Seabrook, NH 03874 and is currently estimated at $1,385,860, approximately $519 per square foot. 393 Plymouth St is a home located in Rockingham County with nearby schools including Seabrook Elementary School, Seabrook Middle School, and Winnacunnet High School.
Ownership History
Date
Name
Owned For
Owner Type
Purchase Details
Closed on
Sep 8, 2008
Sold by
Caruso Rt
Bought by
Okeefe Dawn L
Current Estimated Value
Home Financials for this Owner
Home Financials are based on the most recent Mortgage that was taken out on this home.
Original Mortgage
$475,000
Outstanding Balance
$318,500
Interest Rate
6.69%
Mortgage Type
Purchase Money Mortgage
Estimated Equity
$1,067,360
Create a Home Valuation Report for This Property
The Home Valuation Report is an in-depth analysis detailing your home's value as well as a comparison with similar homes in the area
Home Values in the Area
Average Home Value in this Area
Purchase History
| Date | Buyer | Sale Price | Title Company |
|---|---|---|---|
| Okeefe Dawn L | $660,000 | -- |
Source: Public Records
Mortgage History
| Date | Status | Borrower | Loan Amount |
|---|---|---|---|
| Open | Okeefe Dawn L | $475,000 |
Source: Public Records
Tax History Compared to Growth
Tax History
| Year | Tax Paid | Tax Assessment Tax Assessment Total Assessment is a certain percentage of the fair market value that is determined by local assessors to be the total taxable value of land and additions on the property. | Land | Improvement |
|---|---|---|---|---|
| 2024 | $12,331 | $1,052,100 | $721,900 | $330,200 |
| 2023 | $12,175 | $806,800 | $549,100 | $257,700 |
| 2022 | $10,654 | $804,100 | $549,100 | $255,000 |
| 2021 | $11,040 | $804,100 | $549,100 | $255,000 |
| 2020 | $10,075 | $630,900 | $426,200 | $204,700 |
| 2019 | $9,937 | $630,900 | $426,200 | $204,700 |
| 2018 | $10,252 | $630,900 | $426,200 | $204,700 |
| 2017 | $9,250 | $569,200 | $364,500 | $204,700 |
| 2016 | $7,788 | $526,600 | $330,900 | $195,700 |
| 2015 | $7,324 | $495,200 | $314,300 | $180,900 |
| 2014 | $7,247 | $474,600 | $293,700 | $180,900 |
| 2013 | $7,247 | $474,600 | $293,700 | $180,900 |
Source: Public Records
Map
Nearby Homes
- 376 Ocean Blvd
- 18 River St
- 9 Tyngsboro St
- 13-15 Ocean Blvd
- 13 Ocean Blvd
- 15 Ocean Blvd
- 3 Harris Ave
- 5 Fellows Ave
- 27 Cross Beach Rd
- 10 Haverhill Ave Unit 1
- 10 Haverhill Ave Unit 2
- 19 Riverview Terrace
- 17 Johnson Ave
- 7 Perkins Ave
- 3 Perkins Ave Unit 2
- 3 Perkins Ave Unit 1
- 27 Perkins Ave
- 22 Perkins Ave
- 128 Ashworth Ave Unit 303
- 22 1/2 I St Unit 2
- 394 Plymouth St
- 392 Plymouth St Unit 1st level
- 392 Plymouth St
- 391 Plymouth St
- 356 Woodstock St
- 395 Plymouth St
- 355 Woodstock St
- 357 Woodstock St
- 401 Plymouth St
- 15 Plymouth St
- 15 Plymouth St
- 19 Plymouth St
- 358 Woodstock St
- 390 Plymouth St
- 354 Portsmouth Ave
- 400 Plymouth St
- 23 Plymouth St
- 396 Portsmouth Ave
- 397 Portsmouth Ave
- 353 Woodstock St