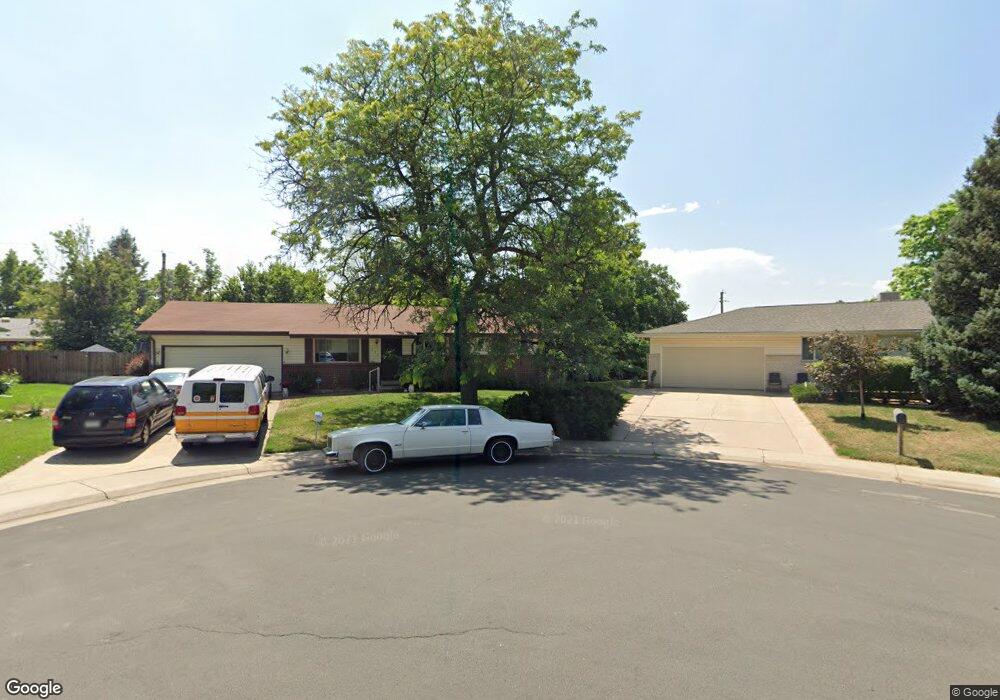
393 S Peoria Cir Aurora, CO 80012
Expo Park NeighborhoodEstimated Value: $426,000 - $492,000
3
Beds
2
Baths
1,499
Sq Ft
$304/Sq Ft
Est. Value
About This Home
This home is located at 393 S Peoria Cir, Aurora, CO 80012 and is currently estimated at $455,735, approximately $304 per square foot. 393 S Peoria Cir is a home located in Arapahoe County with nearby schools including Highline Community Elementary School, Prairie Middle School, and Overland High School.
Ownership History
Date
Name
Owned For
Owner Type
Purchase Details
Closed on
May 20, 2015
Sold by
May Marco A and May Marcos A
Bought by
May Ortegon Marco A
Current Estimated Value
Home Financials for this Owner
Home Financials are based on the most recent Mortgage that was taken out on this home.
Original Mortgage
$187,500
Outstanding Balance
$69,824
Interest Rate
3.71%
Mortgage Type
New Conventional
Estimated Equity
$385,911
Purchase Details
Closed on
Aug 30, 2002
Sold by
Thomas Phillip W
Bought by
May Marcos A
Home Financials for this Owner
Home Financials are based on the most recent Mortgage that was taken out on this home.
Original Mortgage
$212,991
Interest Rate
6.33%
Mortgage Type
FHA
Purchase Details
Closed on
Oct 22, 1992
Sold by
Conversion Arapco
Bought by
Morris John S Morris Sandra D
Purchase Details
Closed on
Jul 4, 1776
Bought by
Conversion Arapco
Create a Home Valuation Report for This Property
The Home Valuation Report is an in-depth analysis detailing your home's value as well as a comparison with similar homes in the area
Home Values in the Area
Average Home Value in this Area
Purchase History
| Date | Buyer | Sale Price | Title Company |
|---|---|---|---|
| May Ortegon Marco A | -- | National 1 Source Title | |
| May Marcos A | $216,000 | -- | |
| Morris John S Morris Sandra D | -- | -- | |
| Conversion Arapco | -- | -- |
Source: Public Records
Mortgage History
| Date | Status | Borrower | Loan Amount |
|---|---|---|---|
| Open | May Ortegon Marco A | $187,500 | |
| Closed | May Marcos A | $212,991 |
Source: Public Records
Tax History Compared to Growth
Tax History
| Year | Tax Paid | Tax Assessment Tax Assessment Total Assessment is a certain percentage of the fair market value that is determined by local assessors to be the total taxable value of land and additions on the property. | Land | Improvement |
|---|---|---|---|---|
| 2024 | $2,134 | $30,840 | -- | -- |
| 2023 | $2,134 | $30,840 | $0 | $0 |
| 2022 | $1,694 | $23,387 | $0 | $0 |
| 2021 | $1,705 | $23,387 | $0 | $0 |
| 2020 | $1,684 | $23,445 | $0 | $0 |
| 2019 | $1,624 | $23,445 | $0 | $0 |
| 2018 | $1,473 | $19,980 | $0 | $0 |
| 2017 | $1,452 | $19,980 | $0 | $0 |
| 2016 | $1,194 | $15,403 | $0 | $0 |
| 2015 | $1,136 | $15,403 | $0 | $0 |
| 2014 | $859 | $10,324 | $0 | $0 |
| 2013 | -- | $11,840 | $0 | $0 |
Source: Public Records
Map
Nearby Homes
- 12204 E Dakota Ave
- 11812 E Alaska Ave
- 11759 E Alaska Ave
- 12434 E Alaska Ave
- 607 S Oswego Ct
- 12161 E Center Dr
- 11623 E Virginia Dr
- 12024 E Maple Ave
- 12072 E Maple Ave
- 346 S Troy St
- 642 S Racine St
- 11608 E Cedar Ave
- 666 S Quentin St
- 11902 E Maple Ave
- 11609 E Cedar Ave
- 12835 E Nevada Ave
- 12802 E Nevada Cir
- 126 S Nome St
- 87 S Nome St
- 105 S Nome St
- 391 S Peoria Cir
- 397 S Peoria Cir
- 12055 E Alaska Ave
- 12005 E Alaska Ave
- 12095 E Alaska Ave
- 383 S Peoria Cir
- 392 S Peoria Cir
- 11993 E Alaska Ave
- 384 S Peoria Cir
- 394 S Peoria Cir
- 12100 E Alaska Place
- 382 S Peoria Cir
- 381 S Peoria Cir
- 11953 E Alaska Ave
- 12109 E Alaska Ave
- 12056 E Alaska Ave
- 304 S Peoria Cir
- 12006 E Alaska Ave
- 302 S Peoria Cir
- 312 S Peoria Cir