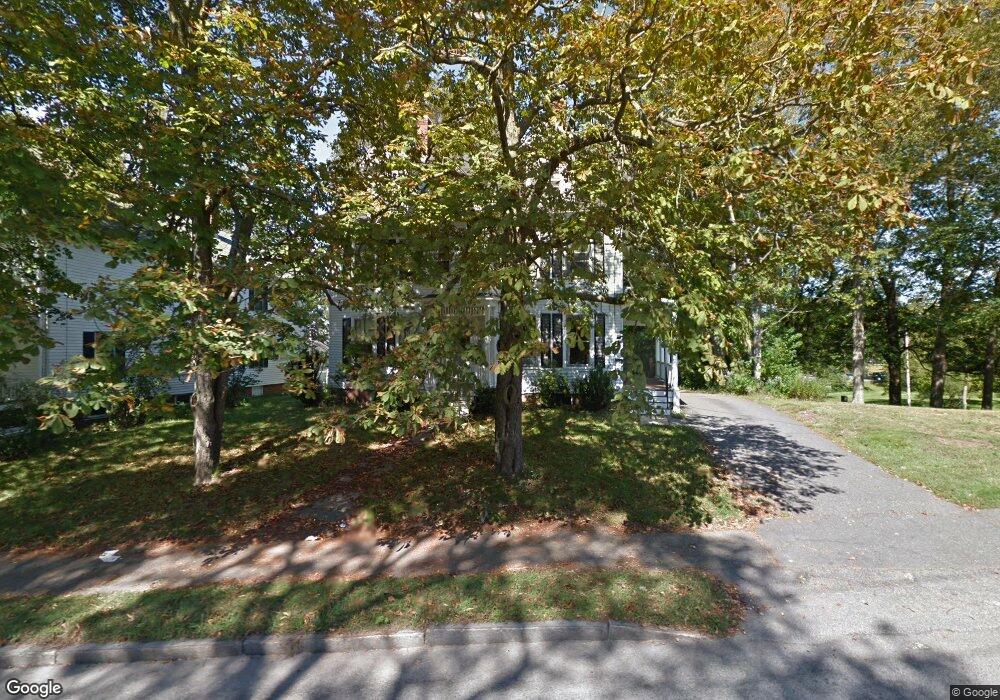
393 South St Portsmouth, NH 03801
Estimated Value: $1,383,000 - $1,661,769
7
Beds
3
Baths
2,453
Sq Ft
$630/Sq Ft
Est. Value
About This Home
This home is located at 393 South St, Portsmouth, NH 03801 and is currently estimated at $1,544,256, approximately $629 per square foot. 393 South St is a home located in Rockingham County with nearby schools including Little Harbour School, Portsmouth Middle School, and Portsmouth High School.
Ownership History
Date
Name
Owned For
Owner Type
Purchase Details
Closed on
Mar 8, 2019
Sold by
Vinciguerra Janat M and Vinciguerra Frank
Bought by
Vinciguerra Ft
Current Estimated Value
Purchase Details
Closed on
Jul 27, 2017
Sold by
Vinciguerra Janet M
Bought by
Vinciguerra Frank and Vinciguerra Janet M
Purchase Details
Closed on
Jun 12, 2017
Sold by
Holt Ft
Bought by
Vinciguerra Janat M
Create a Home Valuation Report for This Property
The Home Valuation Report is an in-depth analysis detailing your home's value as well as a comparison with similar homes in the area
Home Values in the Area
Average Home Value in this Area
Purchase History
| Date | Buyer | Sale Price | Title Company |
|---|---|---|---|
| Vinciguerra Ft | -- | -- | |
| Vinciguerra Frank | -- | -- | |
| Vinciguerra Janat M | -- | -- |
Source: Public Records
Tax History Compared to Growth
Tax History
| Year | Tax Paid | Tax Assessment Tax Assessment Total Assessment is a certain percentage of the fair market value that is determined by local assessors to be the total taxable value of land and additions on the property. | Land | Improvement |
|---|---|---|---|---|
| 2024 | $17,626 | $1,576,600 | $869,500 | $707,100 |
| 2023 | $11,910 | $738,400 | $442,600 | $295,800 |
| 2022 | $11,224 | $738,400 | $442,600 | $295,800 |
| 2021 | $11,098 | $738,400 | $442,600 | $295,800 |
| 2020 | $10,854 | $738,400 | $442,600 | $295,800 |
| 2019 | $10,974 | $738,500 | $442,600 | $295,900 |
| 2018 | $10,793 | $681,400 | $402,300 | $279,100 |
| 2017 | $10,480 | $681,400 | $402,300 | $279,100 |
| 2016 | $10,386 | $609,500 | $361,500 | $248,000 |
| 2015 | $10,234 | $609,500 | $361,500 | $248,000 |
| 2014 | $8,701 | $480,700 | $256,800 | $223,900 |
| 2013 | $8,609 | $480,700 | $256,800 | $223,900 |
| 2012 | $8,436 | $480,700 | $256,800 | $223,900 |
Source: Public Records
Map
Nearby Homes
- 210 South St
- 405 Pleasant St
- 325 Marcy St
- 219 Sagamore Ave
- 34 Highland St
- 33 Gardner St
- 115 Court St
- 161 Wibird St
- 112 Mechanic St
- 21 Madison St
- 238 Austin St
- 90 Fleet St Unit 4-5
- 5 Old Parish Way
- 18 Congress St Unit 308
- 149 Jones Ave
- 80 State St Unit 302
- 198 Islington St Unit 6
- 58 State St
- 20 Chapel St
- 4 Rock St Unit B