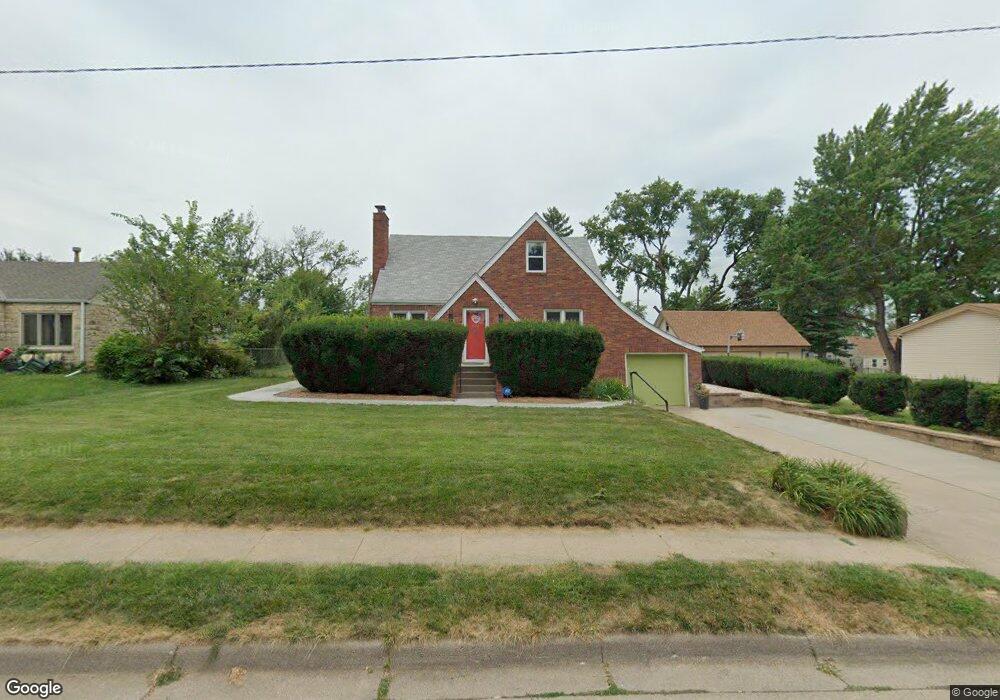
3930 N 53rd St Omaha, NE 68104
North Omaha NeighborhoodEstimated Value: $173,000 - $238,955
3
Beds
2
Baths
1,418
Sq Ft
$149/Sq Ft
Est. Value
About This Home
This home is located at 3930 N 53rd St, Omaha, NE 68104 and is currently estimated at $210,739, approximately $148 per square foot. 3930 N 53rd St is a home located in Douglas County with nearby schools including Fontenelle Elementary School, Monroe Middle School, and Benson Magnet High School.
Ownership History
Date
Name
Owned For
Owner Type
Purchase Details
Closed on
Oct 14, 2024
Sold by
Haskell Elisabeth M and Voris John P
Bought by
Haskell-Voris Elisabeth M
Current Estimated Value
Home Financials for this Owner
Home Financials are based on the most recent Mortgage that was taken out on this home.
Original Mortgage
$161,300
Outstanding Balance
$159,171
Interest Rate
6.35%
Mortgage Type
New Conventional
Estimated Equity
$51,568
Purchase Details
Closed on
May 12, 2011
Sold by
Federal Home Loan Mortgage Corporation
Bought by
Voris John P
Home Financials for this Owner
Home Financials are based on the most recent Mortgage that was taken out on this home.
Original Mortgage
$78,263
Interest Rate
4.5%
Mortgage Type
FHA
Purchase Details
Closed on
Mar 21, 2011
Sold by
Knapstein Erika Tr
Bought by
Federal Home Loan Mortgage Corp
Home Financials for this Owner
Home Financials are based on the most recent Mortgage that was taken out on this home.
Original Mortgage
$78,263
Interest Rate
4.5%
Mortgage Type
FHA
Create a Home Valuation Report for This Property
The Home Valuation Report is an in-depth analysis detailing your home's value as well as a comparison with similar homes in the area
Home Values in the Area
Average Home Value in this Area
Purchase History
| Date | Buyer | Sale Price | Title Company |
|---|---|---|---|
| Haskell-Voris Elisabeth M | -- | None Listed On Document | |
| Haskell-Voris Elisabeth M | -- | None Listed On Document | |
| Voris John P | $80,300 | First American Els | |
| Federal Home Loan Mortgage Corp | $74,000 | -- |
Source: Public Records
Mortgage History
| Date | Status | Borrower | Loan Amount |
|---|---|---|---|
| Open | Haskell-Voris Elisabeth M | $161,300 | |
| Closed | Haskell-Voris Elisabeth M | $161,300 | |
| Previous Owner | Voris John P | $78,263 |
Source: Public Records
Tax History Compared to Growth
Tax History
| Year | Tax Paid | Tax Assessment Tax Assessment Total Assessment is a certain percentage of the fair market value that is determined by local assessors to be the total taxable value of land and additions on the property. | Land | Improvement |
|---|---|---|---|---|
| 2024 | $3,625 | $212,300 | $19,500 | $192,800 |
| 2023 | $3,625 | $171,800 | $19,500 | $152,300 |
| 2022 | $3,667 | $171,800 | $19,500 | $152,300 |
| 2021 | $2,504 | $118,300 | $19,500 | $98,800 |
| 2020 | $2,533 | $118,300 | $19,500 | $98,800 |
| 2019 | $2,248 | $104,700 | $12,000 | $92,700 |
| 2018 | $2,701 | $125,600 | $12,000 | $113,600 |
| 2017 | $1,949 | $90,200 | $8,600 | $81,600 |
| 2016 | $1,936 | $90,200 | $8,600 | $81,600 |
| 2015 | $1,910 | $90,200 | $8,600 | $81,600 |
| 2014 | $1,910 | $90,200 | $8,600 | $81,600 |
Source: Public Records
Map
Nearby Homes
- 3909 N 53rd St
- 3818 N 53rd St
- 3902 N 52nd St
- 3812 N 52nd St
- 4114 N 53rd St
- 3705 N 56th St
- 4401 N 53rd St
- 5721 Manderson St
- 4406 N 52nd St
- 4410 N 52nd St
- 5015 Spaulding St
- 5809 Spaulding St
- 5627 Northwest Dr
- 5228 Ames Ave
- 4408 N 56th St
- 5846 Sahler St
- 5016 Evans St
- 3320 N 55th St
- 3623 N 60th St
- 4924 Evans St