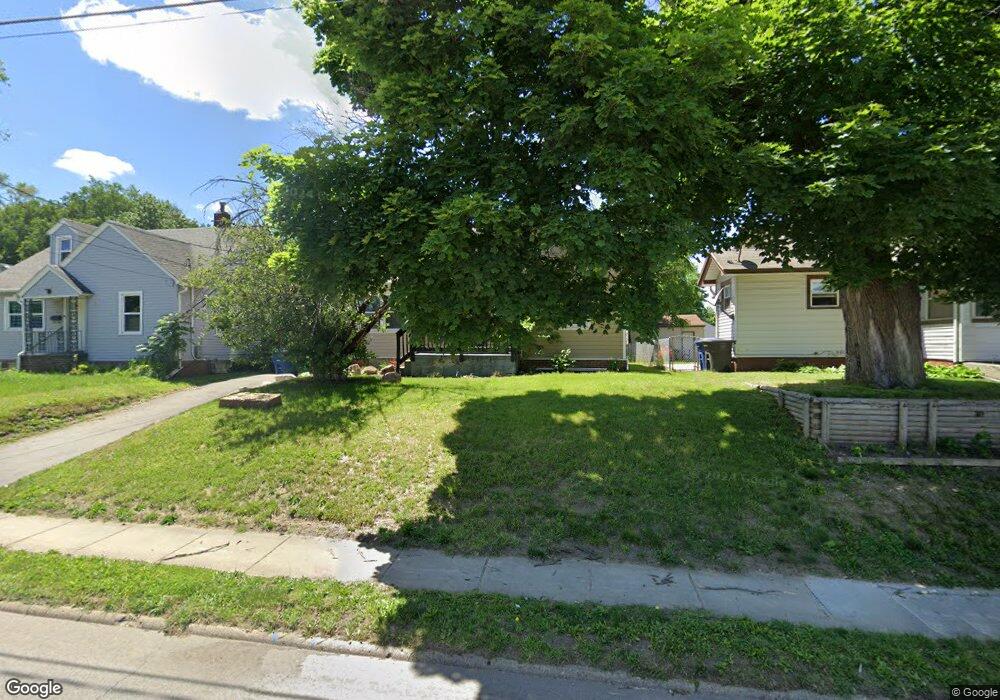
3932 2nd Ave Des Moines, IA 50313
Highland Park NeighborhoodEstimated Value: $135,000 - $196,000
2
Beds
1
Bath
1,138
Sq Ft
$155/Sq Ft
Est. Value
About This Home
This home is located at 3932 2nd Ave, Des Moines, IA 50313 and is currently estimated at $176,143, approximately $154 per square foot. 3932 2nd Ave is a home located in Polk County with nearby schools including Oak Park Elementary School, Harding Middle School, and North High School.
Ownership History
Date
Name
Owned For
Owner Type
Purchase Details
Closed on
Sep 26, 2025
Sold by
Green Mt Llc
Bought by
Millan Construction Llc
Current Estimated Value
Home Financials for this Owner
Home Financials are based on the most recent Mortgage that was taken out on this home.
Original Mortgage
$116,550
Outstanding Balance
$24,087
Interest Rate
20%
Mortgage Type
Construction
Estimated Equity
$152,056
Purchase Details
Closed on
Oct 12, 2023
Sold by
Hill Betty A
Bought by
Betty Hill Trust and Hill
Purchase Details
Closed on
Mar 12, 2021
Sold by
Hill Ronnie D
Bought by
Hill Betty A
Purchase Details
Closed on
Jan 5, 2012
Sold by
Federal National Mortgage Association
Bought by
Hill Ronnie and Hill Betty
Purchase Details
Closed on
Aug 16, 2011
Sold by
Citimortgage Inc
Bought by
Federal National Mortgage Association
Purchase Details
Closed on
Jun 9, 2011
Sold by
Utteridge Robert A
Bought by
Citimortgage Inc
Create a Home Valuation Report for This Property
The Home Valuation Report is an in-depth analysis detailing your home's value as well as a comparison with similar homes in the area
Home Values in the Area
Average Home Value in this Area
Purchase History
| Date | Buyer | Sale Price | Title Company |
|---|---|---|---|
| Millan Construction Llc | $117,000 | None Listed On Document | |
| Green Mt Llc | $117,000 | None Listed On Document | |
| Betty Hill Trust | -- | None Listed On Document | |
| Hill Betty A | -- | -- | |
| Hill Ronnie | -- | None Available | |
| Federal National Mortgage Association | -- | None Available | |
| Citimortgage Inc | $157,317 | None Available |
Source: Public Records
Mortgage History
| Date | Status | Borrower | Loan Amount |
|---|---|---|---|
| Open | Millan Construction Llc | $116,550 |
Source: Public Records
Tax History
| Year | Tax Paid | Tax Assessment Tax Assessment Total Assessment is a certain percentage of the fair market value that is determined by local assessors to be the total taxable value of land and additions on the property. | Land | Improvement |
|---|---|---|---|---|
| 2025 | $3,222 | $185,600 | $26,100 | $159,500 |
| 2024 | $3,222 | $163,800 | $22,600 | $141,200 |
| 2023 | $3,142 | $163,800 | $22,600 | $141,200 |
| 2022 | $3,118 | $133,300 | $19,100 | $114,200 |
| 2021 | $2,954 | $133,300 | $19,100 | $114,200 |
| 2020 | $3,070 | $118,400 | $17,100 | $101,300 |
| 2019 | $2,968 | $118,400 | $17,100 | $101,300 |
| 2018 | $2,936 | $110,400 | $15,500 | $94,900 |
| 2017 | $2,704 | $110,400 | $15,500 | $94,900 |
| 2016 | $2,636 | $100,000 | $14,000 | $86,000 |
| 2015 | $2,636 | $100,000 | $14,000 | $86,000 |
| 2014 | $2,718 | $102,300 | $14,000 | $88,300 |
Source: Public Records
Map
Nearby Homes
Your Personal Tour Guide
Ask me questions while you tour the home.