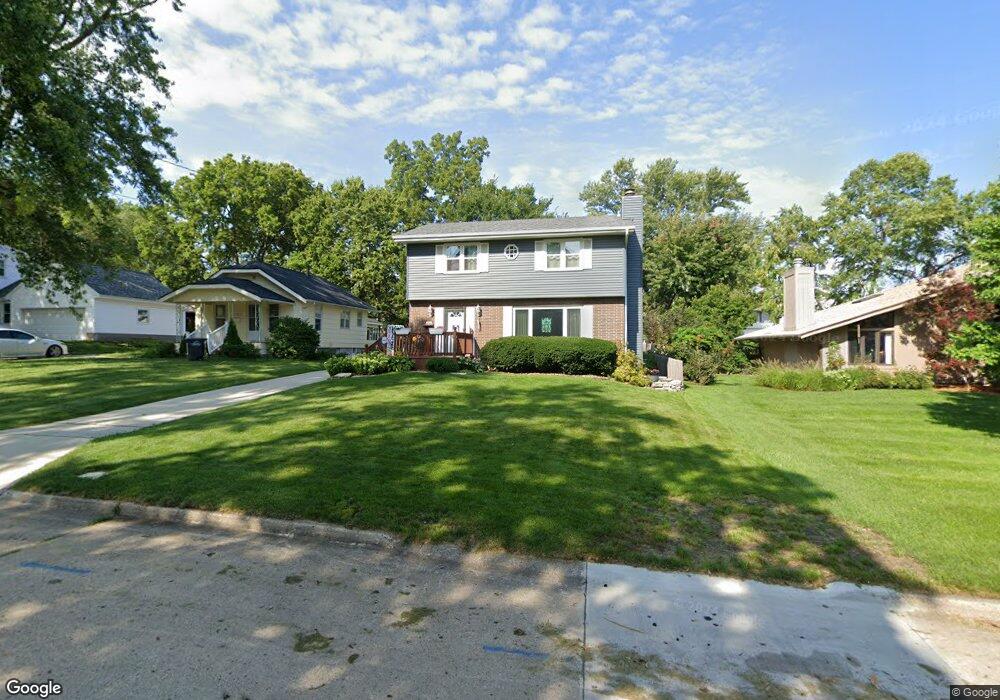
3932 43rd St Des Moines, IA 50310
Lower Beaver NeighborhoodEstimated Value: $248,000 - $270,000
4
Beds
2
Baths
1,470
Sq Ft
$174/Sq Ft
Est. Value
About This Home
This home is located at 3932 43rd St, Des Moines, IA 50310 and is currently estimated at $255,948, approximately $174 per square foot. 3932 43rd St is a home located in Polk County with nearby schools including Samuelson Elementary School, Meredith Middle School, and Hoover High School.
Ownership History
Date
Name
Owned For
Owner Type
Purchase Details
Closed on
Feb 22, 2016
Sold by
Knudsen Allen
Bought by
Knudsen Allen and Sutherland Carolyn R
Current Estimated Value
Purchase Details
Closed on
Apr 30, 2012
Sold by
Sutherland Carolyn R
Bought by
Knudsen Allen
Home Financials for this Owner
Home Financials are based on the most recent Mortgage that was taken out on this home.
Original Mortgage
$127,687
Outstanding Balance
$88,195
Interest Rate
3.91%
Mortgage Type
VA
Estimated Equity
$167,753
Purchase Details
Closed on
May 12, 2006
Sold by
Sutherland Dorothy M
Bought by
Sutherland Dorothy M
Create a Home Valuation Report for This Property
The Home Valuation Report is an in-depth analysis detailing your home's value as well as a comparison with similar homes in the area
Home Values in the Area
Average Home Value in this Area
Purchase History
| Date | Buyer | Sale Price | Title Company |
|---|---|---|---|
| Knudsen Allen | -- | None Available | |
| Knudsen Allen | $124,500 | None Available | |
| Sutherland Dorothy M | -- | None Available |
Source: Public Records
Mortgage History
| Date | Status | Borrower | Loan Amount |
|---|---|---|---|
| Open | Knudsen Allen | $127,687 |
Source: Public Records
Tax History
| Year | Tax Paid | Tax Assessment Tax Assessment Total Assessment is a certain percentage of the fair market value that is determined by local assessors to be the total taxable value of land and additions on the property. | Land | Improvement |
|---|---|---|---|---|
| 2025 | $3,882 | $247,100 | $40,200 | $206,900 |
| 2024 | $3,882 | $223,400 | $35,900 | $187,500 |
| 2023 | $4,016 | $223,400 | $35,900 | $187,500 |
| 2022 | $3,984 | $182,700 | $30,000 | $152,700 |
| 2021 | $4,054 | $182,700 | $30,000 | $152,700 |
| 2020 | $4,204 | $174,300 | $28,500 | $145,800 |
| 2019 | $3,916 | $174,300 | $28,500 | $145,800 |
| 2018 | $3,870 | $157,500 | $25,200 | $132,300 |
| 2017 | $3,438 | $157,500 | $25,200 | $132,300 |
| 2016 | $3,342 | $138,900 | $21,900 | $117,000 |
| 2015 | $3,342 | $138,900 | $21,900 | $117,000 |
| 2014 | $3,210 | $137,700 | $21,300 | $116,400 |
Source: Public Records
Map
Nearby Homes
- 4038 Beaver Ave
- 3838 Sherman Blvd
- 3831 40th St
- 4501 Aurora Ave
- 3900 Crestwood Rd
- 3824 Marianna Trail
- 3838 48th Place
- 3838 Valdez Dr
- 4339 Ovid Ave
- 3900 Clinton Ave
- 3815 Clinton Ave
- 3833 38th St
- 3403 47th St
- 4402 Ovid Ave
- 4506 Palm Ave
- 3324 47th St
- 3215 44th St
- 3213 45th St
- 4119 Ardmore Rd
- 3825 51st St
Your Personal Tour Guide
Ask me questions while you tour the home.