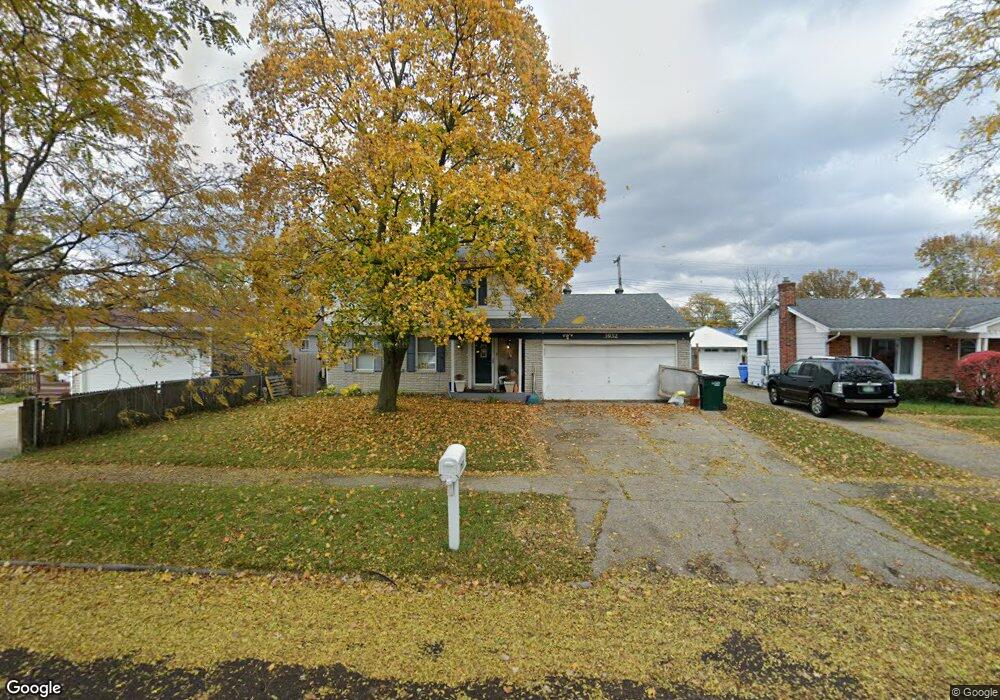
3932 Windward Dr Lansing, MI 48911
Lansing-Eaton NeighborhoodEstimated Value: $216,000 - $237,000
4
Beds
3
Baths
2,083
Sq Ft
$109/Sq Ft
Est. Value
About This Home
This home is located at 3932 Windward Dr, Lansing, MI 48911 and is currently estimated at $226,839, approximately $108 per square foot. 3932 Windward Dr is a home located in Eaton County with nearby schools including Averill Elementary School, Attwood School, and J.W. Sexton High School.
Ownership History
Date
Name
Owned For
Owner Type
Purchase Details
Closed on
Jun 23, 2005
Sold by
Whitford Farin D and Whitford Catherine S
Bought by
Lounds Jason and Lounds Keila
Current Estimated Value
Home Financials for this Owner
Home Financials are based on the most recent Mortgage that was taken out on this home.
Original Mortgage
$128,700
Interest Rate
5.69%
Mortgage Type
New Conventional
Purchase Details
Closed on
Nov 11, 2004
Sold by
Federal Home Loan Mortgage Corporation
Bought by
Whitford Farin D and Whitford Catherine S
Home Financials for this Owner
Home Financials are based on the most recent Mortgage that was taken out on this home.
Original Mortgage
$81,600
Interest Rate
4.5%
Mortgage Type
Purchase Money Mortgage
Purchase Details
Closed on
Dec 4, 2003
Sold by
Joy Patricia and Joy Bobby
Bought by
Wells Fargo Home Mortgage Inc
Create a Home Valuation Report for This Property
The Home Valuation Report is an in-depth analysis detailing your home's value as well as a comparison with similar homes in the area
Home Values in the Area
Average Home Value in this Area
Purchase History
| Date | Buyer | Sale Price | Title Company |
|---|---|---|---|
| Lounds Jason | $143,000 | 1St American | |
| Whitford Farin D | $102,000 | First American | |
| Wells Fargo Home Mortgage Inc | $119,084 | -- |
Source: Public Records
Mortgage History
| Date | Status | Borrower | Loan Amount |
|---|---|---|---|
| Previous Owner | Lounds Jason | $128,700 | |
| Previous Owner | Whitford Farin D | $81,600 | |
| Closed | Whitford Farin D | $15,300 |
Source: Public Records
Tax History Compared to Growth
Tax History
| Year | Tax Paid | Tax Assessment Tax Assessment Total Assessment is a certain percentage of the fair market value that is determined by local assessors to be the total taxable value of land and additions on the property. | Land | Improvement |
|---|---|---|---|---|
| 2025 | $3,699 | $104,100 | $0 | $0 |
| 2024 | $6,556 | $97,700 | $0 | $0 |
| 2023 | $6,556 | $87,900 | $0 | $0 |
| 2022 | $3,171 | $78,800 | $0 | $0 |
| 2021 | $3,045 | $77,300 | $0 | $0 |
| 2020 | $3,031 | $68,000 | $0 | $0 |
| 2019 | $2,951 | $61,100 | $0 | $0 |
| 2018 | $2,742 | $50,400 | $0 | $0 |
| 2017 | $2,685 | $48,100 | $0 | $0 |
| 2016 | $2,136 | $48,000 | $0 | $0 |
| 2015 | -- | $48,200 | $0 | $0 |
| 2014 | -- | $48,000 | $0 | $0 |
| 2013 | -- | $50,200 | $0 | $0 |
Source: Public Records
Map
Nearby Homes
- 4018 Clayborn Rd
- 4009 Heathgate Dr
- 4107 Windward Dr
- 4328 Chadburne Dr
- 4130 Windward Dr
- 4400 Chadburne Dr
- 3941 Glenburne Blvd
- 3526 Berwick Dr
- 4317 Seaway Dr
- 4024 Stillwell Ave
- 3700 W Holmes Rd
- 4123 Balmoral Dr
- 3600 Ronald St
- 4000 Churchill Ave
- 3115 Risdale Ave
- 3200 Lawdor Rd
- 2800 S Waverly Hwy
- 3100 Glenbrook Dr
- 3006 Hillcrest St
- 5100 Wexford Rd
- 3926 Windward Dr
- 3920 Windward Dr
- 3944 Windward Dr
- 3916 Windward Dr
- 3933 Windward Dr
- 3901 Bayview Dr
- 3927 Windward Dr
- 3939 Windward Dr
- 3950 Windward Dr
- 3921 Windward Dr
- 3945 Windward Dr
- 3910 Windward Dr
- 3917 Windward Dr
- 3949 Windward Dr
- 3932 Windemere Dr
- 3825 Bayview Dr
- 3911 Windward Dr
- 3938 Windemere Dr
- 3926 Windemere Dr