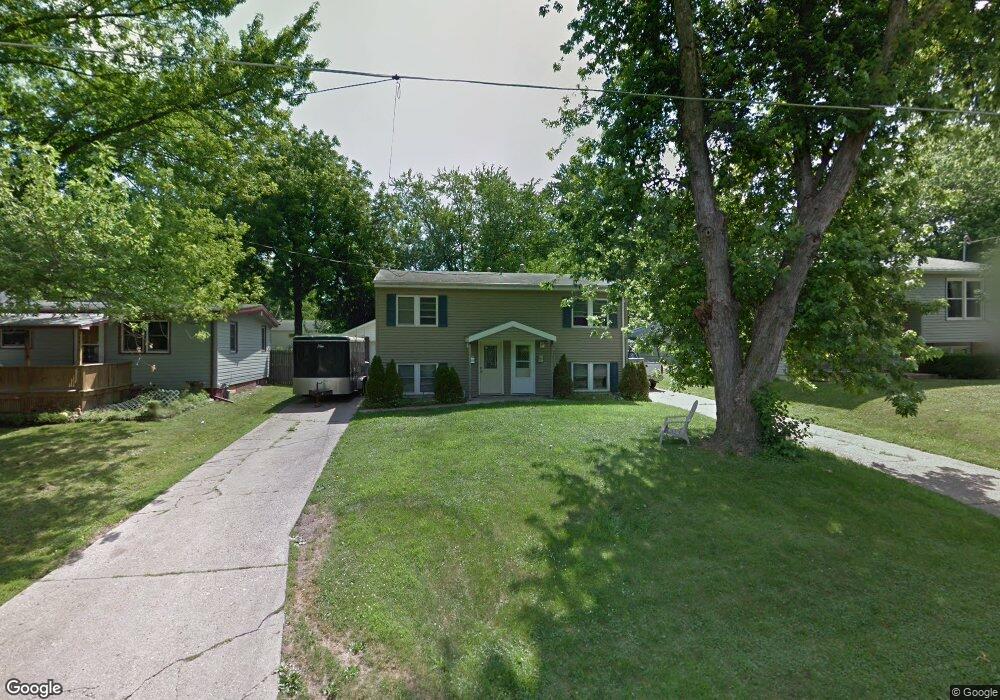
3933 53rd St Des Moines, IA 50310
Merle Hay NeighborhoodEstimated Value: $209,000 - $230,371
2
Beds
2
Baths
884
Sq Ft
$248/Sq Ft
Est. Value
About This Home
This home is located at 3933 53rd St, Des Moines, IA 50310 and is currently estimated at $219,593, approximately $248 per square foot. 3933 53rd St is a home located in Polk County with nearby schools including Moore Elementary School, Meredith Middle School, and Hoover High School.
Ownership History
Date
Name
Owned For
Owner Type
Purchase Details
Closed on
Oct 31, 2017
Sold by
Rosonke Jason R and Rosonke Suzanne L
Bought by
Kcrb Properties Llc
Current Estimated Value
Home Financials for this Owner
Home Financials are based on the most recent Mortgage that was taken out on this home.
Original Mortgage
$200,000
Outstanding Balance
$167,101
Interest Rate
3.83%
Mortgage Type
Future Advance Clause Open End Mortgage
Estimated Equity
$52,492
Purchase Details
Closed on
Apr 7, 2003
Sold by
Suljic Dalija and Suljic Rasma
Bought by
Rosanke Jason R
Home Financials for this Owner
Home Financials are based on the most recent Mortgage that was taken out on this home.
Original Mortgage
$105,600
Interest Rate
5.86%
Purchase Details
Closed on
Jul 2, 1999
Sold by
Grady Junior W and Grady Elaine H
Bought by
Suljic Dalija and Suljic Mevlida
Home Financials for this Owner
Home Financials are based on the most recent Mortgage that was taken out on this home.
Original Mortgage
$95,000
Interest Rate
7.43%
Create a Home Valuation Report for This Property
The Home Valuation Report is an in-depth analysis detailing your home's value as well as a comparison with similar homes in the area
Home Values in the Area
Average Home Value in this Area
Purchase History
| Date | Buyer | Sale Price | Title Company |
|---|---|---|---|
| Kcrb Properties Llc | $155,000 | None Available | |
| Rosanke Jason R | $131,500 | -- | |
| Suljic Dalija | $99,500 | -- |
Source: Public Records
Mortgage History
| Date | Status | Borrower | Loan Amount |
|---|---|---|---|
| Open | Kcrb Properties Llc | $200,000 | |
| Previous Owner | Rosanke Jason R | $105,600 | |
| Previous Owner | Suljic Dalija | $95,000 | |
| Closed | Suljic Dalija | $2,500 |
Source: Public Records
Tax History
| Year | Tax Paid | Tax Assessment Tax Assessment Total Assessment is a certain percentage of the fair market value that is determined by local assessors to be the total taxable value of land and additions on the property. | Land | Improvement |
|---|---|---|---|---|
| 2025 | $4,280 | $246,200 | $47,700 | $198,500 |
| 2024 | $4,280 | $217,600 | $41,500 | $176,100 |
| 2023 | $4,252 | $217,600 | $41,500 | $176,100 |
| 2022 | $4,220 | $180,400 | $36,500 | $143,900 |
| 2021 | $4,230 | $180,400 | $36,500 | $143,900 |
| 2020 | $4,394 | $169,500 | $34,000 | $135,500 |
| 2019 | $4,040 | $169,500 | $34,000 | $135,500 |
| 2018 | $3,998 | $150,300 | $29,800 | $120,500 |
| 2017 | $3,700 | $150,300 | $29,800 | $120,500 |
| 2016 | $3,604 | $136,800 | $26,700 | $110,100 |
| 2015 | $3,604 | $136,800 | $26,700 | $110,100 |
| 2014 | $3,324 | $129,800 | $24,800 | $105,000 |
Source: Public Records
Map
Nearby Homes