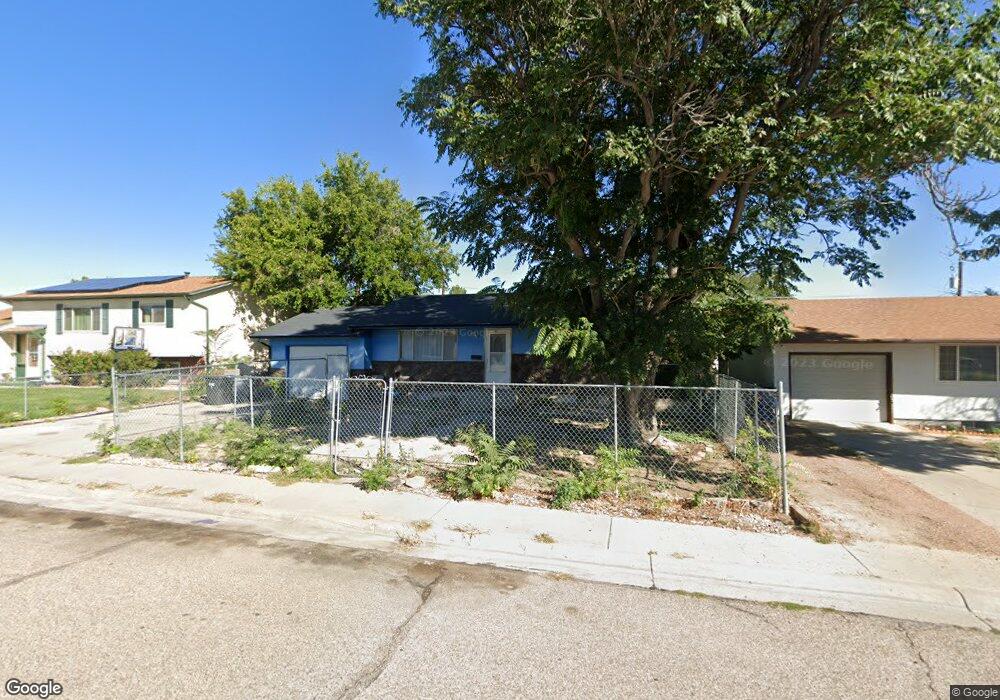
3933 Azalea St Pueblo, CO 81005
Highland Park NeighborhoodEstimated Value: $137,738 - $282,000
3
Beds
1
Bath
1,512
Sq Ft
$128/Sq Ft
Est. Value
About This Home
This home is located at 3933 Azalea St, Pueblo, CO 81005 and is currently estimated at $194,185, approximately $128 per square foot. 3933 Azalea St is a home located in Pueblo County with nearby schools including Highland Park Elementary School, Roncalli STEM Academy, and South High School.
Ownership History
Date
Name
Owned For
Owner Type
Purchase Details
Closed on
Jul 28, 2025
Sold by
Moreno Anthony D
Bought by
Propertyworkx Llc
Current Estimated Value
Purchase Details
Closed on
Jul 2, 2008
Sold by
Perkins Sean and Perkins Wendy Jean
Bought by
Moreno Anthony D
Home Financials for this Owner
Home Financials are based on the most recent Mortgage that was taken out on this home.
Original Mortgage
$112,829
Interest Rate
5.99%
Mortgage Type
FHA
Purchase Details
Closed on
Mar 12, 1999
Sold by
Tack Keith W + Jacqueline C
Bought by
Perkins Sean + Wendy Jean
Purchase Details
Closed on
Feb 17, 1994
Sold by
Tack Keith W + Jacqueline May
Bought by
Tack Keith W + Jacqueline C
Purchase Details
Closed on
Aug 27, 1981
Sold by
Jaramillo Robert R + Sally B
Bought by
Tack Keith W + Jacqueline May
Create a Home Valuation Report for This Property
The Home Valuation Report is an in-depth analysis detailing your home's value as well as a comparison with similar homes in the area
Home Values in the Area
Average Home Value in this Area
Purchase History
| Date | Buyer | Sale Price | Title Company |
|---|---|---|---|
| Propertyworkx Llc | $140,000 | Land Title Guarantee | |
| Moreno Anthony D | $114,600 | Land Title Guarantee Company | |
| Perkins Sean + Wendy Jean | $82,000 | -- | |
| Tack Keith W + Jacqueline C | -- | -- | |
| Tack Keith W + Jacqueline May | $35,000 | -- |
Source: Public Records
Mortgage History
| Date | Status | Borrower | Loan Amount |
|---|---|---|---|
| Previous Owner | Moreno Anthony D | $112,829 |
Source: Public Records
Tax History Compared to Growth
Tax History
| Year | Tax Paid | Tax Assessment Tax Assessment Total Assessment is a certain percentage of the fair market value that is determined by local assessors to be the total taxable value of land and additions on the property. | Land | Improvement |
|---|---|---|---|---|
| 2024 | $1,342 | $13,680 | -- | -- |
| 2023 | $1,357 | $17,370 | $1,340 | $16,030 |
| 2022 | $1,301 | $13,110 | $1,390 | $11,720 |
| 2021 | $1,342 | $13,480 | $1,430 | $12,050 |
| 2020 | $974 | $13,480 | $1,430 | $12,050 |
| 2019 | $974 | $9,645 | $858 | $8,787 |
| 2018 | $732 | $8,076 | $864 | $7,212 |
| 2017 | $739 | $8,076 | $864 | $7,212 |
| 2016 | $719 | $7,910 | $955 | $6,955 |
| 2015 | $716 | $7,910 | $955 | $6,955 |
| 2014 | $718 | $7,921 | $955 | $6,966 |
Source: Public Records
Map
Nearby Homes
- 3935 Farabaugh Ln
- 3940 Hollybrook Ln
- 3914 Bison Ln
- 123 Carrillon Ln
- 194 Bridle Trail
- 2680 Elmwood Cir
- 3500 Ringtail Ln
- 2650 Elmwood Cir
- 232 Alhambra Dr
- 2611 Elmwood Cir
- 3438 Badger Ct
- 3500 Canterbury Ln
- 204 Bridle Trail
- 3734 Raccoon Ln
- 37 Portero Dr
- 303 Starlite Dr
- 212 Bridle Trail
- 172 Encino Dr
- 3534 Wapiti Ln
- 2133 Oakwood Ln
- 3935 Azalea St
- 3931 Azalea St
- 3932 Lancaster Dr
- 3934 Lancaster Dr
- 3930 Lancaster Dr
- 3937 Azalea St
- 3929 Azalea St
- 3936 Lancaster Dr
- 3928 Lancaster Dr
- 3932 Azalea St
- 3934 Azalea St
- 3930 Azalea St
- 3939 Azalea St
- 3927 Azalea St
- 3936 Azalea St
- 3928 Azalea St
- 3938 Lancaster Dr
- 3926 Lancaster Dr
- 3941 Azalea St
- 3938 Azalea St