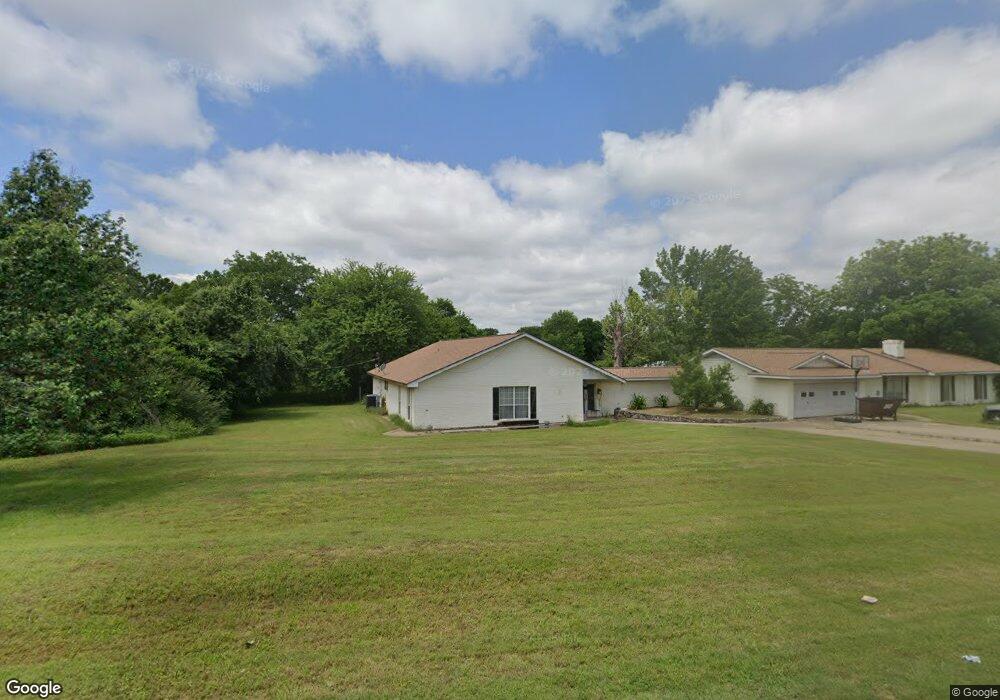
3933 County Road 801 Cleburne, TX 76031
Estimated Value: $565,000 - $742,000
4
Beds
3
Baths
4,046
Sq Ft
$169/Sq Ft
Est. Value
About This Home
This home is located at 3933 County Road 801, Cleburne, TX 76031 and is currently estimated at $682,198, approximately $168 per square foot. 3933 County Road 801 is a home located in Johnson County with nearby schools including Plum Creek Elementary School, Joshua High School - 9th Grade Campus, and Joshua High School.
Ownership History
Date
Name
Owned For
Owner Type
Purchase Details
Closed on
Sep 17, 2013
Sold by
Fannie Mae
Bought by
Carnley Kenneth
Current Estimated Value
Home Financials for this Owner
Home Financials are based on the most recent Mortgage that was taken out on this home.
Original Mortgage
$175,648
Outstanding Balance
$131,385
Interest Rate
4.46%
Mortgage Type
FHA
Estimated Equity
$550,813
Purchase Details
Closed on
Feb 20, 2013
Sold by
Metlife Homes Loans
Bought by
Fannie Mae and Federal National Mortgage Association
Purchase Details
Closed on
Dec 4, 2012
Sold by
Hackett Issac and Hackett Beverly L
Bought by
Metlife Bank N A
Purchase Details
Closed on
Nov 29, 2005
Sold by
Brown Jason P and Brown Miranda
Bought by
Hackett Isaac
Home Financials for this Owner
Home Financials are based on the most recent Mortgage that was taken out on this home.
Original Mortgage
$164,000
Interest Rate
6.3%
Mortgage Type
Purchase Money Mortgage
Create a Home Valuation Report for This Property
The Home Valuation Report is an in-depth analysis detailing your home's value as well as a comparison with similar homes in the area
Home Values in the Area
Average Home Value in this Area
Purchase History
| Date | Buyer | Sale Price | Title Company |
|---|---|---|---|
| Carnley Kenneth | -- | None Available | |
| Fannie Mae | -- | None Available | |
| Metlife Bank N A | $206,953 | None Available | |
| Hackett Isaac | -- | Fatco |
Source: Public Records
Mortgage History
| Date | Status | Borrower | Loan Amount |
|---|---|---|---|
| Open | Carnley Kenneth | $175,648 | |
| Previous Owner | Hackett Isaac | $164,000 |
Source: Public Records
Tax History Compared to Growth
Tax History
| Year | Tax Paid | Tax Assessment Tax Assessment Total Assessment is a certain percentage of the fair market value that is determined by local assessors to be the total taxable value of land and additions on the property. | Land | Improvement |
|---|---|---|---|---|
| 2025 | $2,302 | $669,441 | $198,475 | $470,966 |
| 2024 | $4,899 | $280,882 | $0 | $0 |
| 2023 | $2,230 | $311,436 | $151,775 | $159,661 |
| 2022 | $4,173 | $311,436 | $151,775 | $159,661 |
| 2021 | $3,841 | $211,031 | $51,370 | $159,661 |
| 2020 | $4,163 | $211,031 | $51,370 | $159,661 |
| 2019 | $3,737 | $177,811 | $18,150 | $159,661 |
| 2018 | $3,879 | $177,811 | $18,150 | $159,661 |
| 2017 | $3,840 | $176,161 | $16,500 | $159,661 |
| 2016 | $3,840 | $176,161 | $16,500 | $159,661 |
| 2015 | $3,479 | $176,161 | $16,500 | $159,661 |
| 2014 | $3,479 | $176,161 | $16,500 | $159,661 |
Source: Public Records
Map
Nearby Homes
- 4120 County Road 801
- 4433 County Road 801
- 3704 County Road 801
- 1043 County Road 701a
- 3532 Dove Creek Rd
- 1301 County Road 705
- TBD County Road 701a
- 3601 Dove Creek Rd
- 3956 Redbird Ln
- 2308 Chickering Rd
- 2591 Hopewell Rd
- 7016 Valley View Dr
- 7008 Valley View Dr
- 7004 Valley View Dr
- 4229 N Main St
- 2308 County Road 801c
- 6020 Glenwood Dr
- 4208 N Main St
- 239 Ranch Rd
- 308 E Vaughn Rd
- 3929 County Road 801
- 3925 County Road 801
- 4209 County Road 801
- TBD County Road 801
- 3923 County Road 801
- 3921 County Road 801
- 4052 County Road 801
- 4608 Buffalo Ln
- 1000 Fm 3048
- 0 Farm To Market 3048
- 3913 County Road 801
- 4104 County Road 801
- 4600 Buffalo Ln
- 4617 Buffalo Ln
- 4112 County Road 801 Unit D
- 4112 County Road 801
- 4609 Buffalo Ln
- 3909 County Road 801
- 4516 Buffalo Ln
- 4601 Buffalo Ln