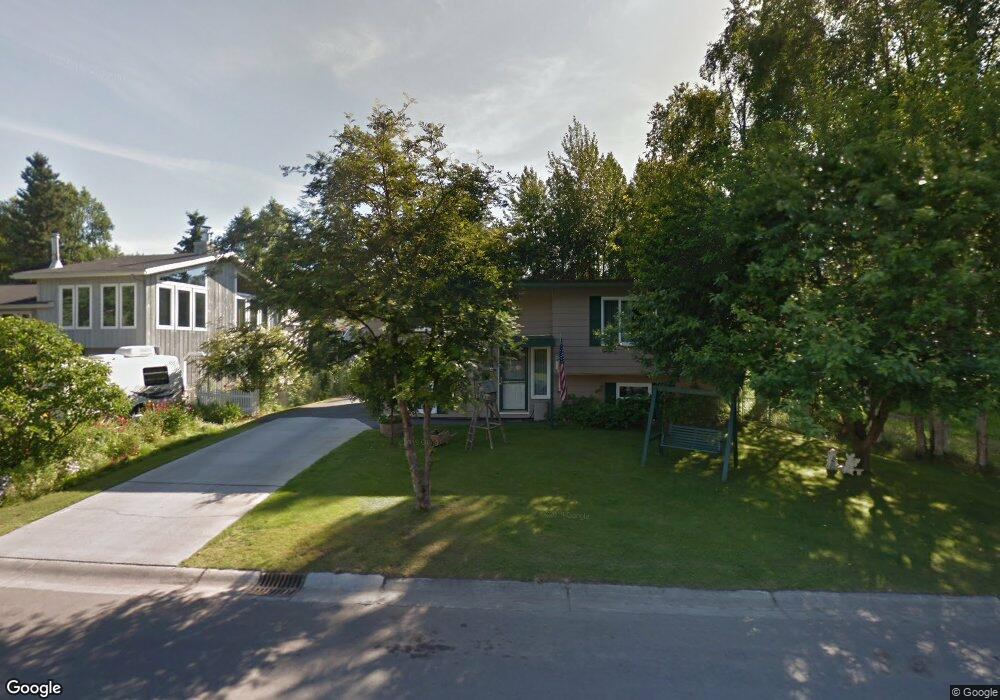
3933 Deborah Ln Anchorage, AK 99504
Scenic Foothills NeighborhoodEstimated Value: $197,000 - $462,000
3
Beds
2
Baths
1,812
Sq Ft
$192/Sq Ft
Est. Value
About This Home
This home is located at 3933 Deborah Ln, Anchorage, AK 99504 and is currently estimated at $347,711, approximately $191 per square foot. 3933 Deborah Ln is a home located in Anchorage Municipality with nearby schools including Scenic Park Elementary School, Nicholas J. Begich Middle School, and Bartlett High School.
Ownership History
Date
Name
Owned For
Owner Type
Purchase Details
Closed on
Aug 14, 2002
Sold by
Fanger Steven Robert and Fanger Marissa
Bought by
Sledge Mark Alan and Sledge Lisa Kay
Current Estimated Value
Home Financials for this Owner
Home Financials are based on the most recent Mortgage that was taken out on this home.
Original Mortgage
$193,000
Outstanding Balance
$81,434
Interest Rate
6.51%
Mortgage Type
VA
Estimated Equity
$266,277
Purchase Details
Closed on
Sep 29, 1999
Sold by
Steig Jeffery A and Steig Donna L
Bought by
Fanger Steven Robert
Home Financials for this Owner
Home Financials are based on the most recent Mortgage that was taken out on this home.
Original Mortgage
$139,050
Interest Rate
7.97%
Mortgage Type
New Conventional
Purchase Details
Closed on
May 25, 1993
Sold by
Brown Randall L and Alfia Marie
Bought by
Steig Jeffery A and Steig Donna L
Home Financials for this Owner
Home Financials are based on the most recent Mortgage that was taken out on this home.
Original Mortgage
$119,531
Interest Rate
7.5%
Mortgage Type
FHA
Create a Home Valuation Report for This Property
The Home Valuation Report is an in-depth analysis detailing your home's value as well as a comparison with similar homes in the area
Home Values in the Area
Average Home Value in this Area
Purchase History
| Date | Buyer | Sale Price | Title Company |
|---|---|---|---|
| Sledge Mark Alan | -- | -- | |
| Fanger Steven Robert | -- | -- | |
| Steig Jeffery A | -- | -- |
Source: Public Records
Mortgage History
| Date | Status | Borrower | Loan Amount |
|---|---|---|---|
| Open | Sledge Mark Alan | $193,000 | |
| Previous Owner | Fanger Steven Robert | $139,050 | |
| Previous Owner | Steig Jeffery A | $119,531 |
Source: Public Records
Tax History Compared to Growth
Tax History
| Year | Tax Paid | Tax Assessment Tax Assessment Total Assessment is a certain percentage of the fair market value that is determined by local assessors to be the total taxable value of land and additions on the property. | Land | Improvement |
|---|---|---|---|---|
| 2025 | $1,477 | $322,800 | $85,400 | $237,400 |
| 2024 | $1,477 | $316,500 | $85,400 | $231,100 |
| 2023 | $4,876 | $286,300 | $85,400 | $200,900 |
| 2022 | $1,374 | $281,600 | $85,400 | $196,200 |
| 2021 | $4,716 | $261,700 | $85,400 | $176,300 |
| 2020 | $954 | $257,300 | $85,400 | $171,900 |
| 2019 | $796 | $248,300 | $85,400 | $162,900 |
| 2018 | $808 | $249,100 | $85,400 | $163,700 |
| 2017 | $1,337 | $255,400 | $85,400 | $170,000 |
| 2016 | $942 | $261,900 | $82,500 | $179,400 |
| 2015 | $942 | $252,300 | $82,500 | $169,800 |
| 2014 | $942 | $241,000 | $77,800 | $163,200 |
Source: Public Records
Map
Nearby Homes
- 7725 Hennings Way
- 7721 Regal Mountain Dr
- 8050 Pioneer Dr Unit 704
- 7700 Regal Mountain Dr
- 4370 Ambler Cir
- 7134 Ambler Ln Unit 26
- 3500 Skipper St
- 6911 Gemini Dr
- 3832 Sycamore Loop
- L2 B4 E 32nd Ave
- 3515 Lunar Dr
- 4021 Lunar Dr
- 4021 Resurrection Dr
- 7071 Baxter Terrace Cir
- 8010 Little Dipper Ave
- 6738 Lunar Dr Unit F2
- 3909 Resurrection Dr
- 6605 Notting Hill Dr
- 3213 Tayshee Cir
- 3430 Evergreen St
- 3923 Deborah Ln
- 4016 James Dr
- 3943 Deborah Ln
- 3913 Deborah Ln
- 3922 Robin St
- 3934 Deborah Ln
- 3932 Robin St
- 3932 Deborah Ln
- 3930 Deborah Ln
- 3942 Deborah Ln
- 3922 Deborah Ln
- 3910 Robin St
- 3903 Deborah Ln
- 3946 Deborah Ln
- 3912 Deborah Ln
- 3900 Robin St
- 4037 James Dr
- 4027 James Dr
- 4120 James Dr
- 3843 Deborah Ln