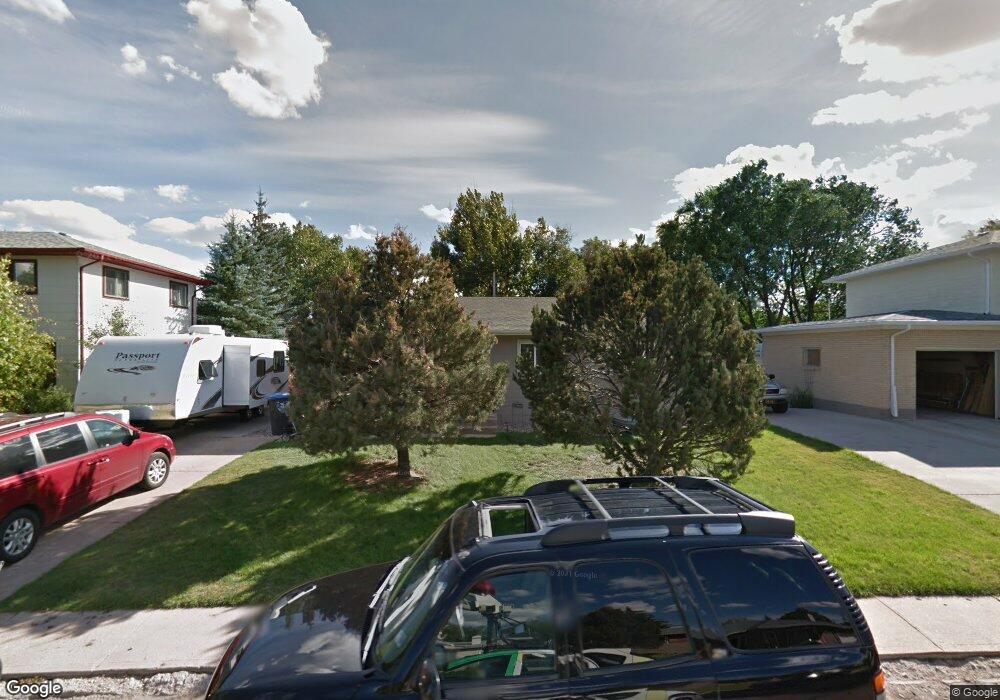
3933 E 7th St Cheyenne, WY 82001
Sun Valley NeighborhoodEstimated Value: $354,000 - $362,644
4
Beds
2
Baths
1,488
Sq Ft
$241/Sq Ft
Est. Value
About This Home
This home is located at 3933 E 7th St, Cheyenne, WY 82001 and is currently estimated at $358,661, approximately $241 per square foot. 3933 E 7th St is a home located in Laramie County with nearby schools including Bain Elementary School, Johnson Junior High School, and South High School.
Ownership History
Date
Name
Owned For
Owner Type
Purchase Details
Closed on
Nov 13, 2019
Sold by
Purrier Richard
Bought by
Vossler Tonya
Current Estimated Value
Home Financials for this Owner
Home Financials are based on the most recent Mortgage that was taken out on this home.
Original Mortgage
$240,463
Outstanding Balance
$214,784
Interest Rate
4.4%
Mortgage Type
FHA
Estimated Equity
$143,877
Purchase Details
Closed on
Oct 31, 2016
Sold by
Feezer Todd M and Feezer Stacy A
Bought by
Purrier Richard
Home Financials for this Owner
Home Financials are based on the most recent Mortgage that was taken out on this home.
Original Mortgage
$215,278
Interest Rate
3.48%
Mortgage Type
VA
Purchase Details
Closed on
Feb 25, 2000
Sold by
Larsen Bonnie D and Weglin Bonnie D
Bought by
Feezer Todd M and Feezer Stacy A
Home Financials for this Owner
Home Financials are based on the most recent Mortgage that was taken out on this home.
Original Mortgage
$85,838
Interest Rate
8.19%
Mortgage Type
FHA
Create a Home Valuation Report for This Property
The Home Valuation Report is an in-depth analysis detailing your home's value as well as a comparison with similar homes in the area
Home Values in the Area
Average Home Value in this Area
Purchase History
| Date | Buyer | Sale Price | Title Company |
|---|---|---|---|
| Vossler Tonya | -- | First American | |
| Purrier Richard | -- | First American Title | |
| Feezer Todd M | -- | -- |
Source: Public Records
Mortgage History
| Date | Status | Borrower | Loan Amount |
|---|---|---|---|
| Open | Vossler Tonya | $240,463 | |
| Previous Owner | Purrier Richard | $215,278 | |
| Previous Owner | Feezer Todd M | $85,838 |
Source: Public Records
Tax History
| Year | Tax Paid | Tax Assessment Tax Assessment Total Assessment is a certain percentage of the fair market value that is determined by local assessors to be the total taxable value of land and additions on the property. | Land | Improvement |
|---|---|---|---|---|
| 2025 | $2,378 | $26,469 | $3,123 | $23,346 |
| 2024 | $2,378 | $33,635 | $4,163 | $29,472 |
| 2023 | $2,164 | $30,607 | $4,163 | $26,444 |
| 2022 | $2,069 | $28,662 | $4,163 | $24,499 |
| 2021 | $1,845 | $25,510 | $4,163 | $21,347 |
| 2020 | $1,705 | $23,636 | $4,163 | $19,473 |
| 2019 | $1,504 | $20,830 | $4,163 | $16,667 |
| 2018 | $1,378 | $19,267 | $3,602 | $15,665 |
| 2017 | $1,336 | $18,508 | $2,899 | $15,609 |
| 2016 | $1,242 | $17,208 | $2,855 | $14,353 |
| 2015 | $1,137 | $15,735 | $2,855 | $12,880 |
| 2014 | $1,121 | $15,424 | $2,855 | $12,569 |
Source: Public Records
Map
Nearby Homes
- 4022 E 7th St
- 810 Cahill Dr
- Lot 2 E 13th St
- 956 Hillcrest Rd
- 821 Stevens Dr
- 3331 Belaire Ave
- 840 Stevens Dr
- 4404 Cottage Ln
- 4400 E 13th St
- 4705 Raleigh Dr
- Lot 10 Raleigh Dr
- Lot 11 Raleigh Dr
- Lot 12 Raleigh Dr
- TBD Livingston Ave
- 4920 E 6th St
- 7723 Three Hearts Trail
- 3518 Randy Rd
- TBD Taft Ave
- 3425 Myers Ct
- 2334 Mccann Ave Unit 56
Your Personal Tour Guide
Ask me questions while you tour the home.