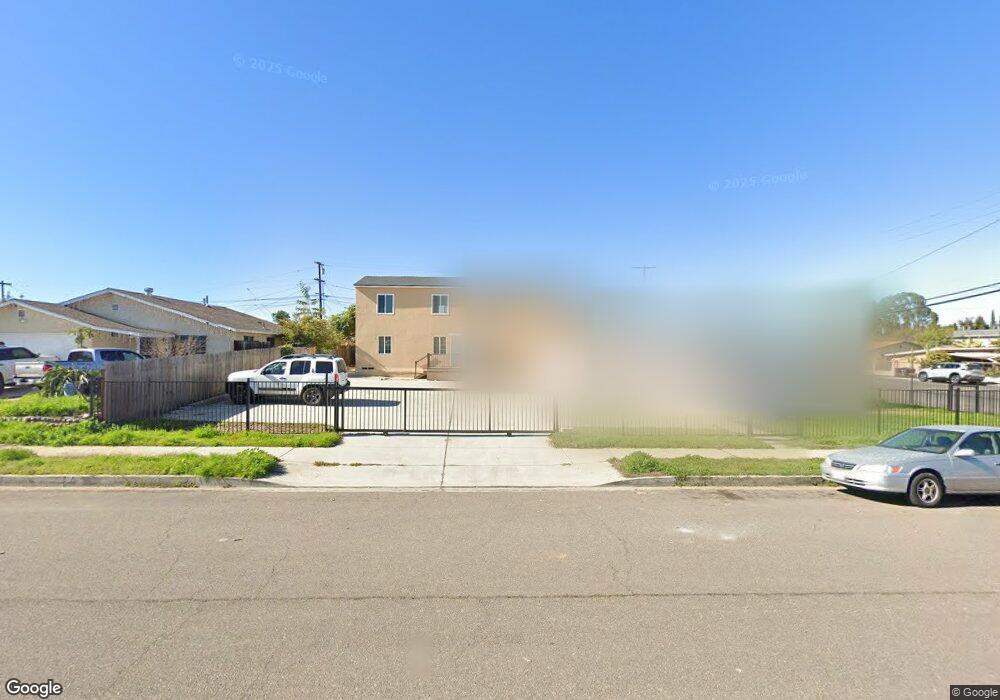
3933 Thorn St San Diego, CA 92105
Castle NeighborhoodEstimated Value: $801,010
1
Bed
2
Baths
3,744
Sq Ft
$214/Sq Ft
Est. Value
About This Home
This home is located at 3933 Thorn St, San Diego, CA 92105 and is currently estimated at $801,010, approximately $213 per square foot. 3933 Thorn St is a home located in San Diego County with nearby schools including Joyner Elementary School, Clark Middle School, and Herbert Hoover High School.
Ownership History
Date
Name
Owned For
Owner Type
Purchase Details
Closed on
Dec 12, 2024
Sold by
Thorn Street 3927 And 3933 Trust and Pham Johnny
Bought by
40Th And Thorn Street San Diego Trust and Tran
Current Estimated Value
Home Financials for this Owner
Home Financials are based on the most recent Mortgage that was taken out on this home.
Original Mortgage
$750,000
Outstanding Balance
$621,197
Interest Rate
6.72%
Mortgage Type
Balloon
Estimated Equity
$179,813
Create a Home Valuation Report for This Property
The Home Valuation Report is an in-depth analysis detailing your home's value as well as a comparison with similar homes in the area
Home Values in the Area
Average Home Value in this Area
Purchase History
| Date | Buyer | Sale Price | Title Company |
|---|---|---|---|
| 40Th And Thorn Street San Diego Trust | $800,000 | Fidelity National Title |
Source: Public Records
Mortgage History
| Date | Status | Borrower | Loan Amount |
|---|---|---|---|
| Open | 40Th And Thorn Street San Diego Trust | $750,000 |
Source: Public Records
Tax History Compared to Growth
Tax History
| Year | Tax Paid | Tax Assessment Tax Assessment Total Assessment is a certain percentage of the fair market value that is determined by local assessors to be the total taxable value of land and additions on the property. | Land | Improvement |
|---|---|---|---|---|
| 2025 | $8,340 | $800,000 | $500,000 | $300,000 |
| 2024 | $8,340 | $676,260 | $468,180 | $208,080 |
| 2023 | $8,156 | $83,115 | $27,624 | $55,491 |
| 2022 | $33 | $83,115 | $27,624 | $55,491 |
| 2021 | $33 | $81,486 | $27,083 | $54,403 |
| 2020 | $33 | $80,652 | $26,806 | $53,846 |
| 2019 | $33 | $79,072 | $26,281 | $52,791 |
| 2018 | $943 | $77,522 | $25,766 | $51,756 |
| 2017 | $32 | $76,003 | $25,261 | $50,742 |
| 2016 | $30 | $74,514 | $24,766 | $49,748 |
| 2015 | $30 | $73,395 | $24,394 | $49,001 |
| 2014 | $30 | $71,959 | $23,917 | $48,042 |
Source: Public Records
Map
Nearby Homes
- 3083 39th St
- 4128 Thorn St
- 3448-50 Cherokee Ave
- 0 42nd Unit PTP2505266
- 3450 42nd St
- 3005 Vancouver Ave
- 2931 Dahlia St Unit 12
- 3421 Vancouver Ave
- 4600 Myrtle Ave
- 2541 Haller St
- 3515 Vancouver Ave
- 3622 Landis St
- 2661 Montclair St
- 3728 Cherokee Ave
- 3322 Nile St
- 2537 Tuberose St
- 2609 Montclair St Unit 11
- 3606 Maple St Unit 12
- 3483 Olive St Unit 85
- 4183 Sycamore Dr