Estimated Value: $446,000 - $486,000
About This Home
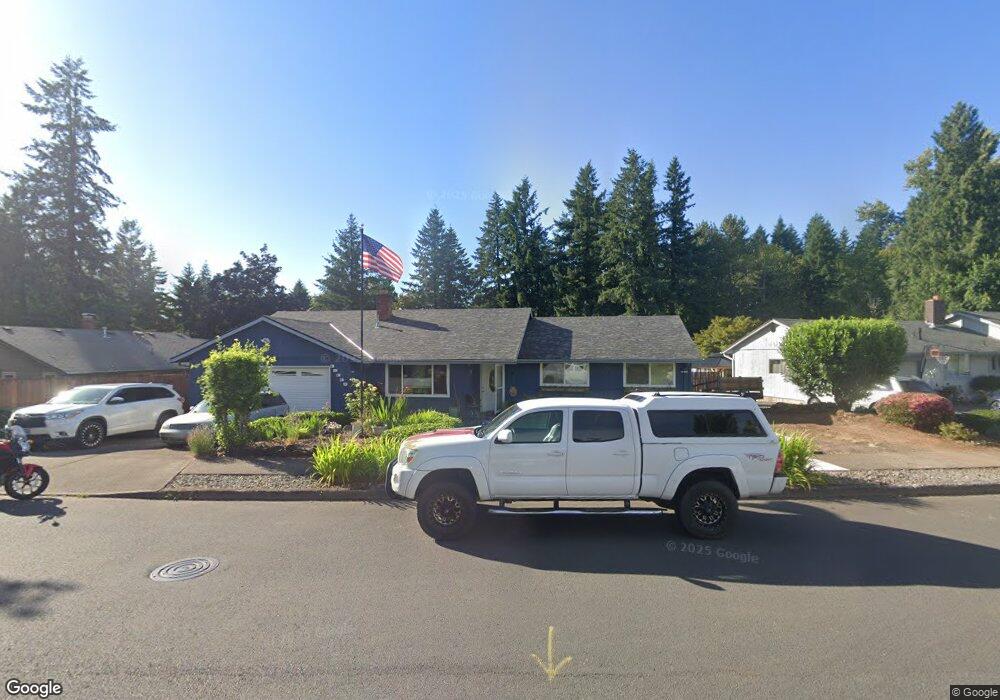
This home is located at 39335 Barker Ct, Sandy, OR 97055 and is currently estimated at $462,323, approximately $347 per square foot. 39335 Barker Ct is a home located in Clackamas County with nearby schools including Sandy Grade School, Cedar Ridge Middle School, and Sandy High School.
Ownership History
We collect this data history from publicly available records. To have your information removed, we recommend requesting removal directly through your county’s website.
Purchase Details
Home Financials for this Owner
Home Financials are based on the most recent Mortgage that was taken out on this home.Purchase Details
Home Financials for this Owner
Home Financials are based on the most recent Mortgage that was taken out on this home.Home Values in the Area
Average Home Value in this Area
Purchase History
We collect this data history from publicly available records. To have your information removed, we recommend requesting removal directly through your county’s website.
| Date | Buyer | Sale Price | Title Company |
|---|---|---|---|
| $272,500 | First American | ||
| -- | Accommodation |
Mortgage History
We collect this data history from publicly available records. To have your information removed, we recommend requesting removal directly through your county’s website.
| Date | Status | Borrower | Loan Amount |
|---|---|---|---|
| Open | $255,550 | ||
| Previous Owner | $178,400 |
Tax History
We collect this data history from publicly available records. To have your information removed, we recommend requesting removal directly through your county’s website.
| Year | Tax Paid | Tax Assessment Tax Assessment Total Assessment is a certain percentage of the fair market value that is determined by local assessors to be the total taxable value of land and additions on the property. | Land | Improvement |
|---|---|---|---|---|
| 2025 | $3,615 | $210,696 | -- | -- |
| 2024 | $3,462 | $204,560 | -- | -- |
| 2023 | $3,462 | $198,602 | $0 | $0 |
| 2022 | $3,280 | $192,818 | $0 | $0 |
| 2021 | $3,167 | $187,202 | $0 | $0 |
| 2020 | $3,081 | $181,750 | $0 | $0 |
| 2019 | $3,052 | $176,457 | $0 | $0 |
| 2018 | $2,966 | $171,317 | $0 | $0 |
| 2017 | $2,895 | $166,327 | $0 | $0 |
| 2016 | $2,795 | $161,483 | $0 | $0 |
| 2015 | $2,716 | $156,780 | $0 | $0 |
| 2014 | $2,644 | $152,214 | $0 | $0 |
Map
- 38915 Sandy Heights St
- 17840 Wolf Dr
- 38909 Sandy Heights St
- 18659 Van Fleet Ave
- 39465 Proctor Blvd
- 38619 Miller St
- 18015 Davis St
- 18377 Davis St
- 39730 Wall St
- 39576 Trillium St
- 18121 SE Langensand Rd
- 39475 Hood St
- 18010 SE Langensand Rd
- 38412 Miller St
- 17271 Scales Ave
- 38565 Pleasant St
- 40348 Therese St
- 38800 Cascadia Village Dr
- 19108 Wellesley Ave
- 16860 Hoffman Ave
- 39365 Barker Ct
- 39295 Barker Ct
- 18070 SE Lamper Ct
- 39360 Barker Ct
- 39320 Gary St
- 39385 Barker Ct
- 39370 Barker Ct
- 18050 SE Lamper Ct
- 39290 Barker Ct
- 39225 Barker Ct
- 39375 Gary St
- 39400 Barker Ct
- 18075 SE Lamper Ct
- 39260 Barker Ct
- 39415 Barker Ct
- 18065 SE Lamper Ct
- 18182 Meinig Ave
- 39425 Gary St
- 39220 Barker Ct
- 39440 Barker Ct
Ask me questions while you tour the home.