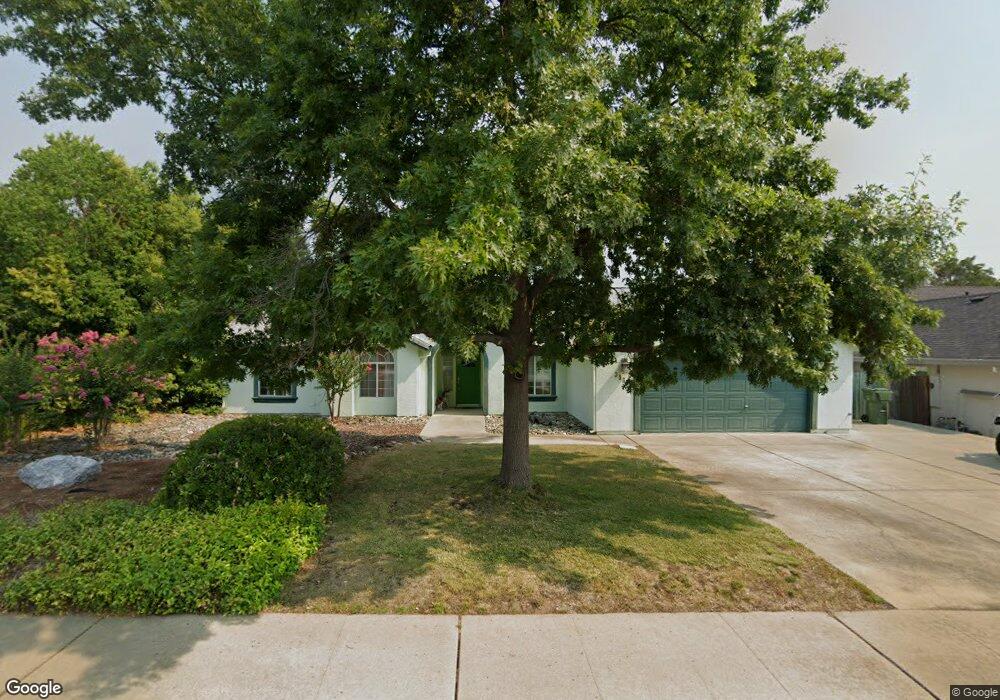
3934 Whitney Ct Redding, CA 96001
Ridgeview NeighborhoodEstimated Value: $440,910 - $469,000
4
Beds
2
Baths
1,800
Sq Ft
$251/Sq Ft
Est. Value
About This Home
This home is located at 3934 Whitney Ct, Redding, CA 96001 and is currently estimated at $451,978, approximately $251 per square foot. 3934 Whitney Ct is a home located in Shasta County with nearby schools including Manzanita Elementary School, Sequoia Middle School, and Shasta High School.
Ownership History
Date
Name
Owned For
Owner Type
Purchase Details
Closed on
Jul 21, 2021
Sold by
Tranberg Nikki and Tranbert Nikki D
Bought by
Tranberg Nikki D and Nikki D Tranberg 2011 Trust
Current Estimated Value
Home Financials for this Owner
Home Financials are based on the most recent Mortgage that was taken out on this home.
Original Mortgage
$127,800
Outstanding Balance
$116,065
Interest Rate
2.96%
Mortgage Type
New Conventional
Estimated Equity
$335,913
Purchase Details
Closed on
Mar 3, 2011
Sold by
Tranberg Nikki D
Bought by
Tranberg Nikki D
Purchase Details
Closed on
Jun 4, 2010
Sold by
Kennedy Lloyd A and Kennedy Morgan A
Bought by
Tranberg Nikki D and Tranberg Dewitt C
Home Financials for this Owner
Home Financials are based on the most recent Mortgage that was taken out on this home.
Original Mortgage
$158,500
Interest Rate
5.05%
Mortgage Type
New Conventional
Create a Home Valuation Report for This Property
The Home Valuation Report is an in-depth analysis detailing your home's value as well as a comparison with similar homes in the area
Home Values in the Area
Average Home Value in this Area
Purchase History
| Date | Buyer | Sale Price | Title Company |
|---|---|---|---|
| Tranberg Nikki D | -- | Placer Title Company | |
| Tranberg Nikki | -- | Placer Title Company | |
| Tranberg Nikki D | -- | None Available | |
| Tranberg Nikki D | $291,000 | Fidelity Natl Title Co Of Ca |
Source: Public Records
Mortgage History
| Date | Status | Borrower | Loan Amount |
|---|---|---|---|
| Open | Tranberg Nikki | $127,800 | |
| Closed | Tranberg Nikki D | $158,500 |
Source: Public Records
Tax History
| Year | Tax Paid | Tax Assessment Tax Assessment Total Assessment is a certain percentage of the fair market value that is determined by local assessors to be the total taxable value of land and additions on the property. | Land | Improvement |
|---|---|---|---|---|
| 2025 | $3,880 | $373,678 | $64,533 | $309,145 |
| 2024 | $3,819 | $366,352 | $63,268 | $303,084 |
| 2023 | $3,819 | $359,170 | $62,028 | $297,142 |
| 2022 | $3,754 | $352,128 | $60,812 | $291,316 |
| 2021 | $3,728 | $345,224 | $59,620 | $285,604 |
| 2020 | $3,774 | $341,685 | $59,009 | $282,676 |
| 2019 | $3,425 | $320,000 | $65,000 | $255,000 |
| 2018 | $3,303 | $300,000 | $65,000 | $235,000 |
| 2017 | $3,219 | $288,400 | $70,000 | $218,400 |
| 2016 | $3,087 | $280,000 | $70,000 | $210,000 |
| 2015 | $2,906 | $266,000 | $65,000 | $201,000 |
| 2014 | $2,752 | $246,000 | $55,000 | $191,000 |
Source: Public Records
Map
Nearby Homes
- 4065 Meander Dr
- 4125 Oro St
- 3882 Fujiyama Way
- 4160 Travona Ct
- 2242 Everest Dr
- 1783 Record Ln
- 1846 Kildare Dr
- 1974 Kildare Dr
- 1695 Kildare Dr
- 2358 Cumberland Dr
- 1692 Kildare Dr
- 1756 Mary Lake Dr
- 2135 Adirondack Dr
- 4519 Nantucket Dr
- 4478 Moyvane Dr
- 3701 Cal Ore Dr
- 3380 Placer St
- 1426 Gladstone Ct
- 16928 Campo Calle
- 4746 Tralee Ln
- 3956 Whitney Ct
- 3912 Whitney Ct
- 3978 Whitney Ct
- 2096 Quartz Way
- The Whitney Ct
- 0 Whitney Ct
- 2094 Quartz Way
- 2098 Quartz Way
- 3945 Whitney Ct
- 2092 Quartz Way
- 3923 Whitney Ct
- 3891 Rushmore Dr
- 3967 Whitney Ct
- 2008 Winchester Place
- 3989 Whitney Ct
- 2090 Quartz Way
- 3894 Rushmore Dr
- 3894 Appalachian Way
- 2016 Winchester Place Unit 1
- 2016 Winchester Place
Your Personal Tour Guide
Ask me questions while you tour the home.