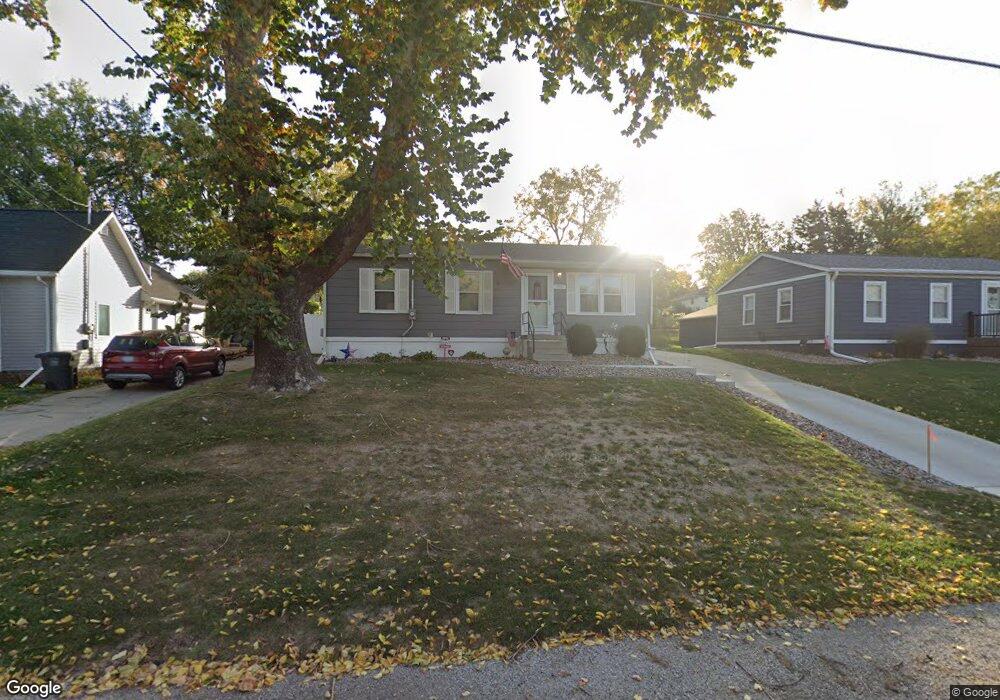
3935 16th St Des Moines, IA 50313
Oak Park NeighborhoodEstimated Value: $192,000 - $211,000
3
Beds
2
Baths
840
Sq Ft
$239/Sq Ft
Est. Value
About This Home
This home is located at 3935 16th St, Des Moines, IA 50313 and is currently estimated at $200,658, approximately $238 per square foot. 3935 16th St is a home located in Polk County with nearby schools including Oak Park Elementary School, Harding Middle School, and North High School.
Ownership History
Date
Name
Owned For
Owner Type
Purchase Details
Closed on
Jul 1, 2022
Sold by
Rice Matthew L
Bought by
Rice Matthew L and Mccann Jami L
Current Estimated Value
Purchase Details
Closed on
Aug 16, 2019
Sold by
Fagen Sally A
Bought by
Rice Matthew
Purchase Details
Closed on
Mar 17, 2005
Sold by
Pecina Lawrence O
Bought by
Rice Matthew L
Home Financials for this Owner
Home Financials are based on the most recent Mortgage that was taken out on this home.
Original Mortgage
$78,764
Interest Rate
5.61%
Mortgage Type
FHA
Create a Home Valuation Report for This Property
The Home Valuation Report is an in-depth analysis detailing your home's value as well as a comparison with similar homes in the area
Home Values in the Area
Average Home Value in this Area
Purchase History
| Date | Buyer | Sale Price | Title Company |
|---|---|---|---|
| Rice Matthew L | -- | None Listed On Document | |
| Rice Matthew | -- | None Available | |
| Rice Matthew L | $79,500 | -- |
Source: Public Records
Mortgage History
| Date | Status | Borrower | Loan Amount |
|---|---|---|---|
| Previous Owner | Rice Matthew L | $78,764 |
Source: Public Records
Tax History Compared to Growth
Tax History
| Year | Tax Paid | Tax Assessment Tax Assessment Total Assessment is a certain percentage of the fair market value that is determined by local assessors to be the total taxable value of land and additions on the property. | Land | Improvement |
|---|---|---|---|---|
| 2025 | $3,398 | $207,700 | $30,800 | $176,900 |
| 2024 | $3,398 | $183,200 | $26,700 | $156,500 |
| 2023 | $3,252 | $183,200 | $26,700 | $156,500 |
| 2022 | $3,226 | $146,900 | $22,600 | $124,300 |
| 2021 | $2,830 | $146,900 | $22,600 | $124,300 |
| 2020 | $2,934 | $122,000 | $20,200 | $101,800 |
| 2019 | $2,808 | $122,000 | $20,200 | $101,800 |
| 2018 | $2,774 | $113,000 | $18,300 | $94,700 |
| 2017 | $2,580 | $113,000 | $18,300 | $94,700 |
| 2016 | $2,052 | $103,900 | $16,500 | $87,400 |
| 2015 | $2,052 | $86,600 | $16,500 | $70,100 |
| 2014 | $1,956 | $85,300 | $16,000 | $69,300 |
Source: Public Records
Map
Nearby Homes