

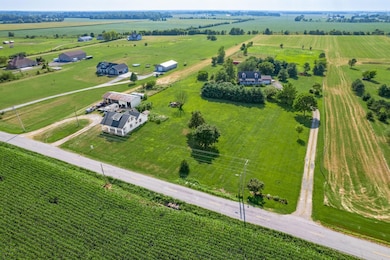
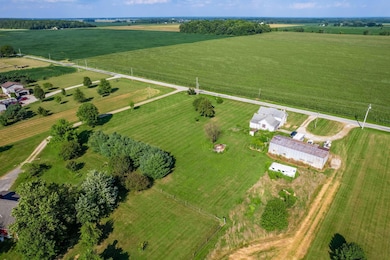
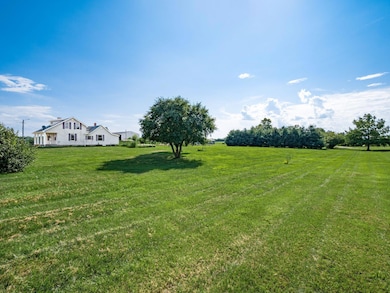
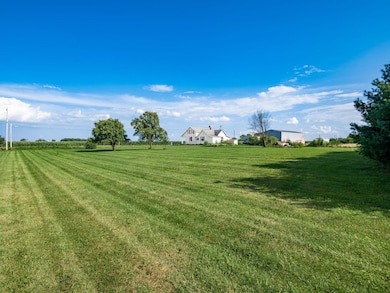
3935 N Section Line Rd Radnor, OH 43066
Estimated payment $1,464/month
Highlights
- Cape Cod Architecture
- Main Floor Primary Bedroom
- No HOA
About This Home
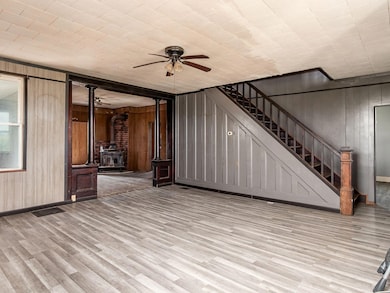
Welcome to 3935 Section Line Road! This great home is located on over 1.5 acres in Buckeye Valley schools and awaiting your personal touches! With a first-floor owner's bedroom and first floor full bath, this is great for those needing exclusive first floor living. Or with the 2 additional bedrooms upstairs they are large and offer many uses from bedrooms, to offices, storage, or hobby rooms. Don't miss the opportunity to turn your vision into reality with this once in a lifetime project opportunity!
Listing Agent
Keller Williams Consultants License #2011003113 Listed on: 08/23/2025

Home Details
Home Type
- Single Family
Est. Annual Taxes
- $1,820
Year Built
- Built in 1901
Lot Details
- 1.59 Acre Lot
Home Design
- Cape Cod Architecture
- Craftsman Architecture
- Farmhouse Style Home
- Stone Foundation
Interior Spaces
- 1,785 Sq Ft Home
- 1.5-Story Property
- Decorative Fireplace
- Basement
- Basement Cellar
- Laundry on main level
Bedrooms and Bathrooms
- 3 Bedrooms | 1 Primary Bedroom on Main
- 1 Full Bathroom
Parking
- No Garage
- Shared Driveway
- Off-Street Parking: 4
Utilities
- Well
- Private Sewer
Community Details
- No Home Owners Association
Listing and Financial Details
- Assessor Parcel Number 620-460-01-076-004
Map
Home Values in the Area
Average Home Value in this Area
Tax History
| Year | Tax Paid | Tax Assessment Tax Assessment Total Assessment is a certain percentage of the fair market value that is determined by local assessors to be the total taxable value of land and additions on the property. | Land | Improvement |
|---|---|---|---|---|
| 2024 | $1,820 | $49,250 | $12,570 | $36,680 |
| 2023 | $1,820 | $49,250 | $12,570 | $36,680 |
| 2022 | $2,075 | $49,880 | $12,570 | $37,310 |
| 2021 | $2,078 | $49,880 | $12,570 | $37,310 |
| 2020 | $2,085 | $49,880 | $12,570 | $37,310 |
| 2019 | $1,556 | $36,650 | $10,920 | $25,730 |
| 2018 | $1,577 | $36,650 | $10,920 | $25,730 |
| 2017 | $1,378 | $33,080 | $9,000 | $24,080 |
| 2016 | $1,270 | $33,080 | $9,000 | $24,080 |
| 2015 | $1,339 | $33,080 | $9,000 | $24,080 |
| 2014 | $1,256 | $33,080 | $9,000 | $24,080 |
| 2013 | $1,301 | $31,720 | $9,000 | $22,720 |
Property History
| Date | Event | Price | List to Sale | Price per Sq Ft |
|---|---|---|---|---|
| 10/16/2025 10/16/25 | Price Changed | $249,000 | -3.9% | $139 / Sq Ft |
| 09/02/2025 09/02/25 | Price Changed | $259,000 | -3.7% | $145 / Sq Ft |
| 08/23/2025 08/23/25 | For Sale | $269,000 | -- | $151 / Sq Ft |
Purchase History
| Date | Type | Sale Price | Title Company |
|---|---|---|---|
| Quit Claim Deed | -- | Preferred Midwest Title Llc | |
| Quit Claim Deed | -- | Preferred Midwest Title Llc | |
| Warranty Deed | $140,000 | Amrock Inc | |
| Warranty Deed | $157,000 | None Available | |
| Interfamily Deed Transfer | -- | None Available | |
| Deed | $86,000 | -- |
Mortgage History
| Date | Status | Loan Amount | Loan Type |
|---|---|---|---|
| Previous Owner | $130,240 | FHA | |
| Previous Owner | $79,755 | New Conventional |
Source: Columbus and Central Ohio Regional MLS
MLS Number: 225028254
APN: 620-460-01-076-004
Disclaimer: Certain information contained herein is derived from information provided by parties other than Homes.com. All information provided is deemed reliable, but is not guaranteed to be accurate and should be independently verified.
![]() IDX information is provided exclusively for personal, non-commercial use, and may not be used for any purpose other than to identify prospective properties consumers may be interested in purchasing.
IDX information is provided exclusively for personal, non-commercial use, and may not be used for any purpose other than to identify prospective properties consumers may be interested in purchasing.
Information is deemed reliable but not guaranteed.
- 2390 Penry Rd
- 2217 Radnor Rd
- 3414 State Route 203
- 541 Willey Rd
- 2310 Troy Rd
- 1258 Hills Miller Rd
- 6412 Troy Rd
- 159 Marblewood Dr
- 174 Sylvan Dr
- 1859 State Route 257 N
- Poitier ESP Plan at Addison Farms - K. Hovnanian's® Four Seasons
- Kelly Plan at Addison Farms - K. Hovnanian's® Four Seasons
- Bernstein Plan at Addison Farms - K. Hovnanian's® Four Seasons
- Astaire Plan at Addison Farms - K. Hovnanian's® Four Seasons
- Stanwyck Plan at Addison Farms - K. Hovnanian's® Four Seasons
- Kerr Plan at Addison Farms - K. Hovnanian's® Four Seasons
- 518 Lamplight Dr
- 389 Garnet Ranch Dr
- 395 Garnet Ranch Dr
- Wexford with Finished Lower Level Plan at Addison Farms - Townhomes
- 1136 Heritage Blvd
- 300 Pne Hl Ct
- 315 Pne Hl Ct
- 305 Pne Hl Ct
- 301 Pne Hl Ct
- 1034 Heritage Blvd
- 585 Bettmann St
- 1004 Heritage Blvd
- 998 Heritage Blvd
- 268 Brandie Dr
- 35 Lucy Ridge Rd
- 24 Glade Loop
- 2228 Bruce Rd
- 583 Beckler Ln
- 60 Gooseberry Dr
- 608 Beckler Ln
- 852 Sunny Vale Dr
- 124 Lippazon Way
- 467 Garnet Ranch Dr
- 90 Burr Oak Dr