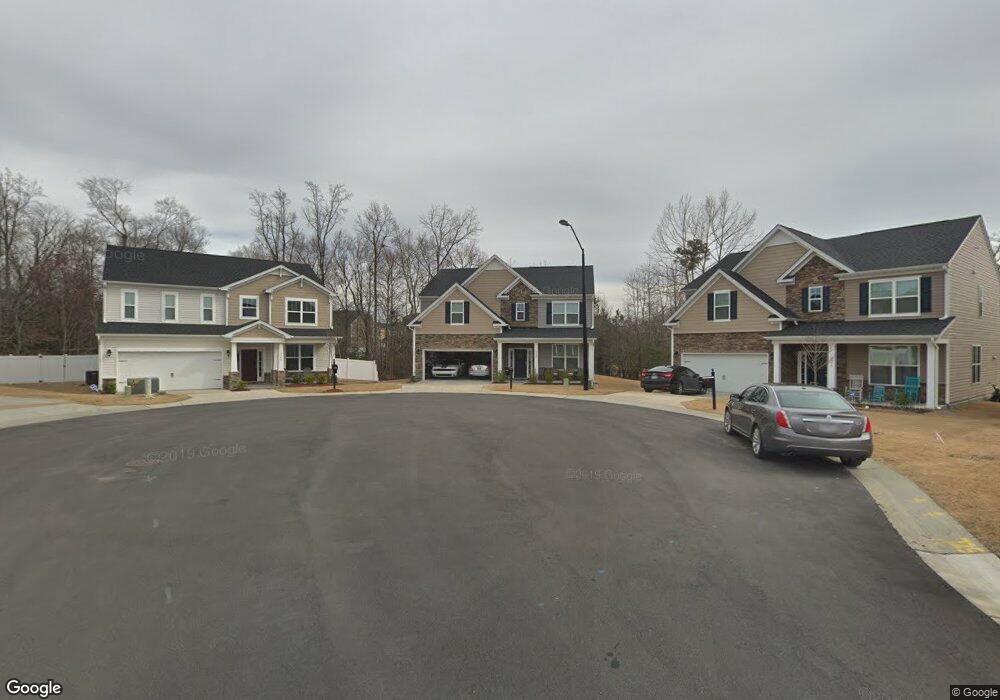
3936 Massey Pointe Ct Unit Lot 269 Raleigh, NC 27616
Forestville NeighborhoodEstimated Value: $437,000 - $455,742
3
Beds
3
Baths
2,366
Sq Ft
$188/Sq Ft
Est. Value
About This Home
This home is located at 3936 Massey Pointe Ct Unit Lot 269, Raleigh, NC 27616 and is currently estimated at $445,686, approximately $188 per square foot. 3936 Massey Pointe Ct Unit Lot 269 is a home located in Wake County with nearby schools including Harris Creek Elementary School, Rolesville Middle School, and Rolesville High School.
Ownership History
Date
Name
Owned For
Owner Type
Purchase Details
Closed on
Sep 26, 2025
Sold by
Williams Jerry M and Williams Joyce A
Bought by
Jerry Miah Williams And Joyce Ann Williams Li and Williams
Current Estimated Value
Purchase Details
Closed on
Jul 30, 2019
Sold by
Pryor Darrell E and Pryor Renorda E
Bought by
Williams Jerry M and Williams Joyce A
Home Financials for this Owner
Home Financials are based on the most recent Mortgage that was taken out on this home.
Original Mortgage
$237,600
Interest Rate
3.8%
Mortgage Type
New Conventional
Purchase Details
Closed on
Sep 8, 2017
Sold by
Beazer Homes Llc
Bought by
Pryor Darrell E and Pryor Renorda E
Home Financials for this Owner
Home Financials are based on the most recent Mortgage that was taken out on this home.
Original Mortgage
$262,153
Interest Rate
3.92%
Mortgage Type
FHA
Create a Home Valuation Report for This Property
The Home Valuation Report is an in-depth analysis detailing your home's value as well as a comparison with similar homes in the area
Home Values in the Area
Average Home Value in this Area
Purchase History
| Date | Buyer | Sale Price | Title Company |
|---|---|---|---|
| Jerry Miah Williams And Joyce Ann Williams Li | -- | None Listed On Document | |
| Williams Jerry M | $297,000 | None Available | |
| Pryor Darrell E | $267,000 | None Available |
Source: Public Records
Mortgage History
| Date | Status | Borrower | Loan Amount |
|---|---|---|---|
| Previous Owner | Williams Jerry M | $237,600 | |
| Previous Owner | Pryor Darrell E | $262,153 |
Source: Public Records
Tax History Compared to Growth
Tax History
| Year | Tax Paid | Tax Assessment Tax Assessment Total Assessment is a certain percentage of the fair market value that is determined by local assessors to be the total taxable value of land and additions on the property. | Land | Improvement |
|---|---|---|---|---|
| 2025 | $3,781 | $431,305 | $100,000 | $331,305 |
| 2024 | $3,766 | $431,305 | $100,000 | $331,305 |
| 2023 | $3,027 | $275,859 | $50,000 | $225,859 |
| 2022 | $2,813 | $275,859 | $50,000 | $225,859 |
| 2021 | $2,704 | $275,859 | $50,000 | $225,859 |
| 2020 | $2,655 | $275,859 | $50,000 | $225,859 |
| 2019 | $2,707 | $231,885 | $44,000 | $187,885 |
| 2018 | $2,554 | $231,885 | $44,000 | $187,885 |
| 2017 | $0 | $44,000 | $44,000 | $0 |
| 2016 | $157 | $44,000 | $44,000 | $0 |
Source: Public Records
Map
Nearby Homes
- 3519 Winding Walk Ct
- 3925 Massey Pointe Ct
- 3922 Massey Run
- 4014 White Kestrel Dr
- 3502 Massey Pond Trail
- 3451 Massey Pond Trail
- 4109 Massey Preserve Trail
- 3709 Fan Palm Ct
- 4009 Shadbush St
- 3242 Landing Falls Ln
- 3152 Landing Falls Ln
- 3742 Nicolyn Dr
- 3401 Grosbeak Way
- 4208 Forestville Rd
- 3912 Cashew Dr
- 4124 Mangrove Dr
- 4060 Granite Ridge Trail
- 4050 Granite Ridge Trail
- 3936 Mountjoy Trail
- 3804 Tritonville Way
- 3936 Massey Pointe Ct
- 3936 Massey Run
- 3932 Massey Pointe Ct
- 3940 Massey Pointe Ct
- 3928 Massey Pointe Ct
- 3937 Massey Pointe Ct
- 3924 Massey Pointe Ct
- 3929 Massey Pointe Ct
- 3907 Big Pond Ct
- 4100 Forestville Rd
- 3911 Big Pond Ct
- 3920 Massey Pointe Ct
- 3903 Big Pond Ct
- 3504 Massey Ridge Ct
- 3921 Massey Pointe Ct
- 3940 White Kestrel Dr
- 3944 White Kestrel Dr
- 3936 White Kestreg Dr Dr
- 3508 Massey Ridge Ct
- 3916 Massey Pointe Ct