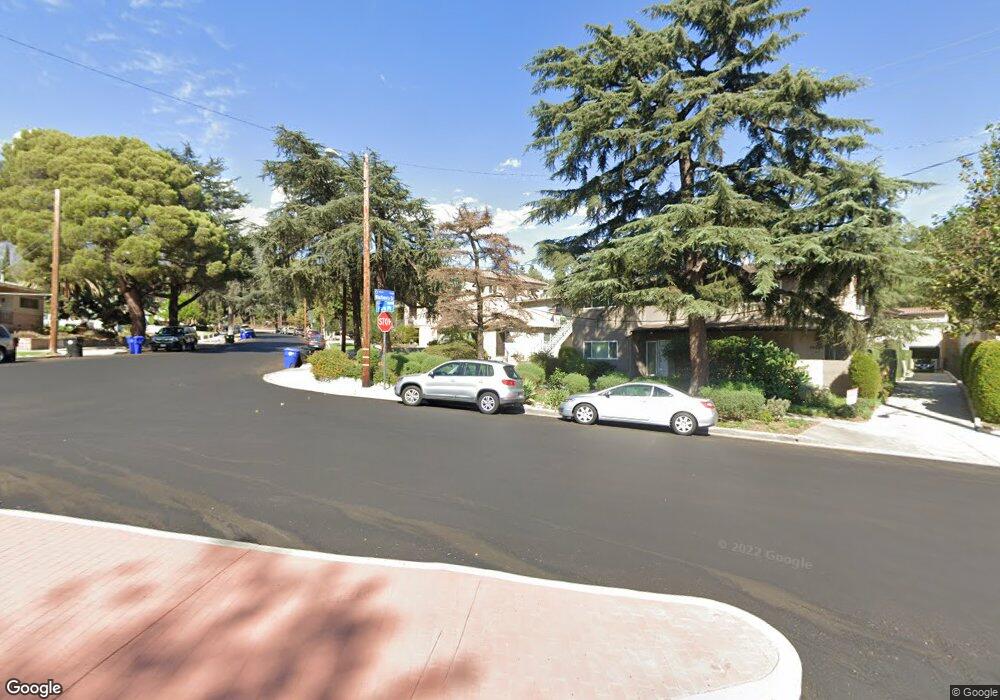
3936 Park Place Montrose, CA 91020
Montecito Park NeighborhoodEstimated Value: $1,283,000 - $1,352,000
4
Beds
3
Baths
1,894
Sq Ft
$690/Sq Ft
Est. Value
About This Home
This home is located at 3936 Park Place, Montrose, CA 91020 and is currently estimated at $1,307,715, approximately $690 per square foot. 3936 Park Place is a home located in Los Angeles County with nearby schools including John C. Fremont Elementary School, Rosemont Middle School, and Crescenta Valley High School.
Ownership History
Date
Name
Owned For
Owner Type
Purchase Details
Closed on
Jul 24, 2015
Sold by
Ghermezian Vartan and Watson Heather
Bought by
Ghermezian Vartan and Watson Heather
Current Estimated Value
Purchase Details
Closed on
Aug 5, 2004
Sold by
Heaney James Joseph
Bought by
Ghermezian Vartan and Ghermezian Heather
Home Financials for this Owner
Home Financials are based on the most recent Mortgage that was taken out on this home.
Original Mortgage
$508,000
Outstanding Balance
$253,915
Interest Rate
6.12%
Mortgage Type
Purchase Money Mortgage
Estimated Equity
$1,053,800
Purchase Details
Closed on
Nov 18, 1997
Sold by
Velasquez Sam R and Velasquez Dora R
Bought by
Heaney James Joseph
Home Financials for this Owner
Home Financials are based on the most recent Mortgage that was taken out on this home.
Original Mortgage
$216,000
Interest Rate
8%
Create a Home Valuation Report for This Property
The Home Valuation Report is an in-depth analysis detailing your home's value as well as a comparison with similar homes in the area
Home Values in the Area
Average Home Value in this Area
Purchase History
| Date | Buyer | Sale Price | Title Company |
|---|---|---|---|
| Ghermezian Vartan | -- | None Available | |
| Ghermezian Vartan | $635,000 | Gateway Title Co | |
| Heaney James Joseph | $285,000 | Commonwealth Land Title Co |
Source: Public Records
Mortgage History
| Date | Status | Borrower | Loan Amount |
|---|---|---|---|
| Open | Ghermezian Vartan | $508,000 | |
| Previous Owner | Heaney James Joseph | $216,000 | |
| Closed | Heaney James Joseph | $57,600 | |
| Closed | Ghermezian Vartan | $63,500 |
Source: Public Records
Tax History Compared to Growth
Tax History
| Year | Tax Paid | Tax Assessment Tax Assessment Total Assessment is a certain percentage of the fair market value that is determined by local assessors to be the total taxable value of land and additions on the property. | Land | Improvement |
|---|---|---|---|---|
| 2025 | $10,296 | $885,118 | $669,070 | $216,048 |
| 2024 | $10,296 | $867,763 | $655,951 | $211,812 |
| 2023 | $9,816 | $850,749 | $643,090 | $207,659 |
| 2022 | $9,454 | $834,069 | $630,481 | $203,588 |
| 2021 | $9,291 | $817,716 | $618,119 | $199,597 |
| 2019 | $8,938 | $793,464 | $599,786 | $193,678 |
| 2018 | $8,778 | $777,907 | $588,026 | $189,881 |
| 2017 | $8,643 | $762,655 | $576,497 | $186,158 |
| 2016 | $8,376 | $747,702 | $565,194 | $182,508 |
| 2015 | $8,198 | $736,472 | $556,705 | $179,767 |
| 2014 | $8,139 | $722,046 | $545,800 | $176,246 |
Source: Public Records
Map
Nearby Homes
- 2222 Montrose Ave Unit G
- 2249 Montrose Ave Unit 7
- 2048 Valderas Dr
- 3470 Downing Ave
- 4430 Rosebank Dr
- 2102 La Canada Crest Dr Unit B
- 3508 Rosemary Ave
- 3658 Sierra Vista Ave
- 3328 N Verdugo Rd
- 4467 Ardara Place
- 2468 Montrose Ave Unit 6
- 4639 El Camino Corto
- 4326 Briggs Ave
- 3226 Menlo Dr
- 4644 Hillard Ave
- 2434 Prospect Ave
- 2522 Fairway Ave
- 1929 Lyans Dr
- 4328 Sunset Ave
- 3120 N Verdugo Rd
- 3936 Park Place
- 1941 Waltonia Dr Unit 303
- 1941 Waltonia Dr Unit 205
- 1941 Waltonia Dr Unit 201
- 1941 Waltonia Dr Unit 301
- 1941 Waltonia Dr Unit 305
- 1941 Waltonia Dr Unit 203
- 1941 Waltonia Dr Unit 200
- 1941 Waltonia Dr Unit 300
- 1941 Waltonia Dr Unit 304
- 1941 Waltonia Dr Unit 204
- 1941 Waltonia Dr
- 3930 Park Place Unit 5
- 3934 Park Place
- 1932 Waltonia Dr
- 1940 Waltonia Dr
- 1928 Waltonia Dr
- 1947 Waltonia Dr
- 1944 Waltonia Dr
- 3924 Park Place