3937 Glenbrook Loop Rd Riddle, OR 97469
Estimated Value: $497,000 - $525,000
2
Beds
2
Baths
1,920
Sq Ft
$264/Sq Ft
Est. Value
About This Home
This home is located at 3937 Glenbrook Loop Rd, Riddle, OR 97469 and is currently estimated at $506,982, approximately $264 per square foot. 3937 Glenbrook Loop Rd is a home located in Douglas County with nearby schools including Riddle High School.
Ownership History
Date
Name
Owned For
Owner Type
Purchase Details
Closed on
May 5, 2010
Sold by
Bobillot Andrew Scott
Bought by
Bobillot Andrew Scott and Bobillot Shannon Sharrisse
Current Estimated Value
Purchase Details
Closed on
Sep 19, 2005
Sold by
Sebaske James and Sebaske Corinn
Bought by
Bobillot Andrew Scott
Purchase Details
Closed on
Nov 8, 2004
Sold by
Mabe Loretta J
Bought by
Sebaske James and Sebaske Corinn
Home Financials for this Owner
Home Financials are based on the most recent Mortgage that was taken out on this home.
Original Mortgage
$83,500
Interest Rate
5.69%
Mortgage Type
Seller Take Back
Purchase Details
Closed on
Apr 30, 2004
Sold by
Bannon Jimmie L
Bought by
Mabe Loretta J
Create a Home Valuation Report for This Property
The Home Valuation Report is an in-depth analysis detailing your home's value as well as a comparison with similar homes in the area
Purchase History
| Date | Buyer | Sale Price | Title Company |
|---|---|---|---|
| Bobillot Andrew Scott | -- | None Available | |
| Bobillot Andrew Scott | $186,900 | First American Title Ins Co | |
| Sebaske James | $92,500 | Amerititle Inc | |
| Mabe Loretta J | -- | -- |
Source: Public Records
Mortgage History
| Date | Status | Borrower | Loan Amount |
|---|---|---|---|
| Previous Owner | Sebaske James | $83,500 |
Source: Public Records
Tax History
| Year | Tax Paid | Tax Assessment Tax Assessment Total Assessment is a certain percentage of the fair market value that is determined by local assessors to be the total taxable value of land and additions on the property. | Land | Improvement |
|---|---|---|---|---|
| 2025 | $1,860 | $223,402 | -- | -- |
| 2024 | $1,805 | $216,896 | -- | -- |
| 2023 | $1,753 | $210,579 | $0 | $0 |
| 2022 | $1,702 | $204,446 | $0 | $0 |
| 2021 | $1,652 | $198,492 | $0 | $0 |
| 2020 | $1,604 | $192,711 | $0 | $0 |
| 2019 | $1,557 | $187,099 | $0 | $0 |
| 2018 | $1,512 | $181,650 | $0 | $0 |
| 2017 | $1,468 | $176,360 | $0 | $0 |
| 2016 | $1,425 | $171,224 | $0 | $0 |
| 2015 | $1,384 | $166,237 | $0 | $0 |
| 2014 | $1,343 | $161,396 | $0 | $0 |
| 2013 | -- | $156,696 | $0 | $0 |
Source: Public Records
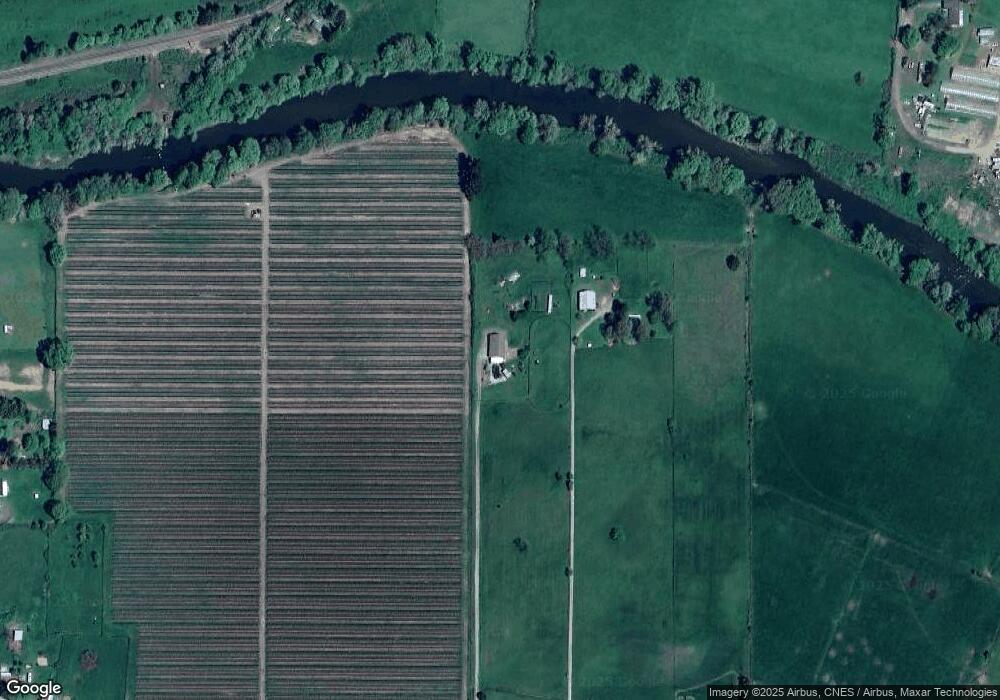
Map
Nearby Homes
- 3161 Glenbrook Loop Rd
- 187 Hackett Ln
- 1320 Shoestring Rd
- 181 Oak Hollow Ln
- 3450 Shoestring Rd
- 238 Ball Ln
- 139 R St
- 221 Main St
- 2100 Boyer Rd
- 334 E 5th Ave
- 334 E 5th Ave Unit 6
- 795 E St
- 450 E 3rd Ave
- 212 Park St
- 4359 Canyonville Riddle Rd
- 579 E 4th Ave
- 631 E 4th Ave
- 663 E 4th Ave
- 0 Second Ave Unit 471745961
- 0 Smith St
- 3961 Glenbrook Loop Rd
- 5362 Riddle By Pass Rd
- 5300 Riddle By Pass Rd
- 3815 Glenbrook Loop Rd
- 185 Hanna View Ln
- 189 Hanna View Ln
- 5208 Riddle By Pass Rd
- 3840 Glenbrook Loop Rd
- 203 Hanna View Ln
- 181 Hanna View Ln
- 207 Hanna View Ln
- 3642 Glenbrook Loop Rd
- 3641 Glenbrook Loop Rd
- 157 Hanna View Ln
- 4261 Glenbrook Loop Rd
- 4539 Glenbrook Loop Rd
- 4581 Glenbrook Loop Rd
- 4283 Glenbrook Loop Rd
- 122 Hanna View Ln
- 4431 Glenbrook Loop Rd
Your Personal Tour Guide
Ask me questions while you tour the home.