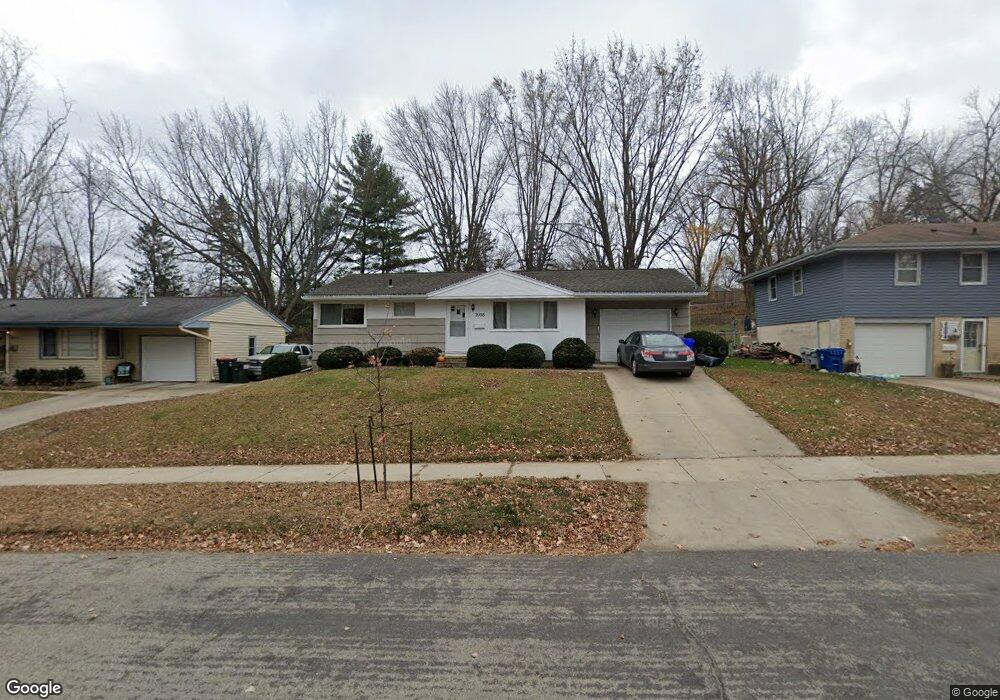
3938 5th St NW Rochester, MN 55901
The Manor NeighborhoodEstimated Value: $263,000 - $284,000
3
Beds
1
Bath
1,684
Sq Ft
$163/Sq Ft
Est. Value
About This Home
This home is located at 3938 5th St NW, Rochester, MN 55901 and is currently estimated at $274,285, approximately $162 per square foot. 3938 5th St NW is a home located in Olmsted County with nearby schools including Bishop Elementary School, John Adams Middle School, and John Marshall Senior High School.
Ownership History
Date
Name
Owned For
Owner Type
Purchase Details
Closed on
Sep 1, 2022
Sold by
Framsted Kimberly and Framsted Robyn
Bought by
Aiello David and Aiello Grace
Current Estimated Value
Home Financials for this Owner
Home Financials are based on the most recent Mortgage that was taken out on this home.
Original Mortgage
$228,000
Outstanding Balance
$218,324
Interest Rate
5.54%
Mortgage Type
New Conventional
Estimated Equity
$55,961
Purchase Details
Closed on
Mar 18, 2016
Sold by
Framsted Kimberly L and Framsted Robyn E K
Bought by
Framsted Kimberly L and Framsted Robyn E K
Home Financials for this Owner
Home Financials are based on the most recent Mortgage that was taken out on this home.
Original Mortgage
$103,500
Interest Rate
3.65%
Mortgage Type
New Conventional
Purchase Details
Closed on
Jul 15, 2009
Sold by
Kocher Lester I
Bought by
Kasper Robyn E
Home Financials for this Owner
Home Financials are based on the most recent Mortgage that was taken out on this home.
Original Mortgage
$120,673
Interest Rate
5.62%
Mortgage Type
FHA
Create a Home Valuation Report for This Property
The Home Valuation Report is an in-depth analysis detailing your home's value as well as a comparison with similar homes in the area
Home Values in the Area
Average Home Value in this Area
Purchase History
| Date | Buyer | Sale Price | Title Company |
|---|---|---|---|
| Aiello David | $240,000 | -- | |
| Framsted Kimberly L | -- | Burnet Title | |
| Kasper Robyn E | $122,900 | Rochester Title |
Source: Public Records
Mortgage History
| Date | Status | Borrower | Loan Amount |
|---|---|---|---|
| Open | Aiello David | $228,000 | |
| Previous Owner | Framsted Kimberly L | $103,500 | |
| Previous Owner | Kasper Robyn E | $120,673 |
Source: Public Records
Tax History Compared to Growth
Tax History
| Year | Tax Paid | Tax Assessment Tax Assessment Total Assessment is a certain percentage of the fair market value that is determined by local assessors to be the total taxable value of land and additions on the property. | Land | Improvement |
|---|---|---|---|---|
| 2024 | $3,124 | $223,500 | $42,000 | $181,500 |
| 2023 | $2,634 | $209,200 | $42,000 | $167,200 |
| 2022 | $2,346 | $203,600 | $42,000 | $161,600 |
| 2021 | $2,254 | $170,500 | $30,000 | $140,500 |
| 2020 | $2,292 | $163,700 | $30,000 | $133,700 |
| 2019 | $2,188 | $159,600 | $30,000 | $129,600 |
| 2018 | $1,725 | $153,100 | $30,000 | $123,100 |
| 2017 | $1,670 | $123,800 | $22,000 | $101,800 |
| 2016 | $1,636 | $114,500 | $22,000 | $92,500 |
| 2015 | $1,540 | $109,600 | $22,000 | $87,600 |
| 2014 | $1,486 | $109,600 | $22,000 | $87,600 |
| 2012 | -- | $106,800 | $25,000 | $81,800 |
Source: Public Records
Map
Nearby Homes
- 3586 6th St NW
- 3938 7th St NW
- 650 36th Ave NW
- 660 36th Ave NW
- 4339 Manor Park Dr NW
- 468 Panorama Cir NW
- 188 37th Ave NW
- 3415 Lake St NW
- 700 Panorama Cir NW
- 4119 Manor View Dr NW
- 4444 3rd St NW
- 3304 Lake St NW
- 4541 Ruby Ln NW
- 4992 4th St NW
- 360 Wimbledon Hills Dr SW
- 3324 Fox Hollow Ln SW
- 822 Fox Pointe Ln SW
- 810 Foxcroft Cir SW
- 3046 Jeremiah Ln NW
- 4921 8th St SW
- 4004 5th St NW
- 3932 5th St NW
- 3926 5th St NW
- 4012 5th St NW
- 3929 4th Place NW
- 3923 4th Place NW
- 4003 4th Place NW
- 3920 5th St NW
- 3915 4th Place NW
- 3935 5th St NW
- 3941 5th St NW
- 4016 5th St NW
- 4003 4th Place NW
- 3929 5th St NW
- 4005 5th St NW
- 4013 4th Place NW
- 3914 5th St NW
- 3923 5th St NW
- 3909 4th Place NW
- 4022 5th St NW