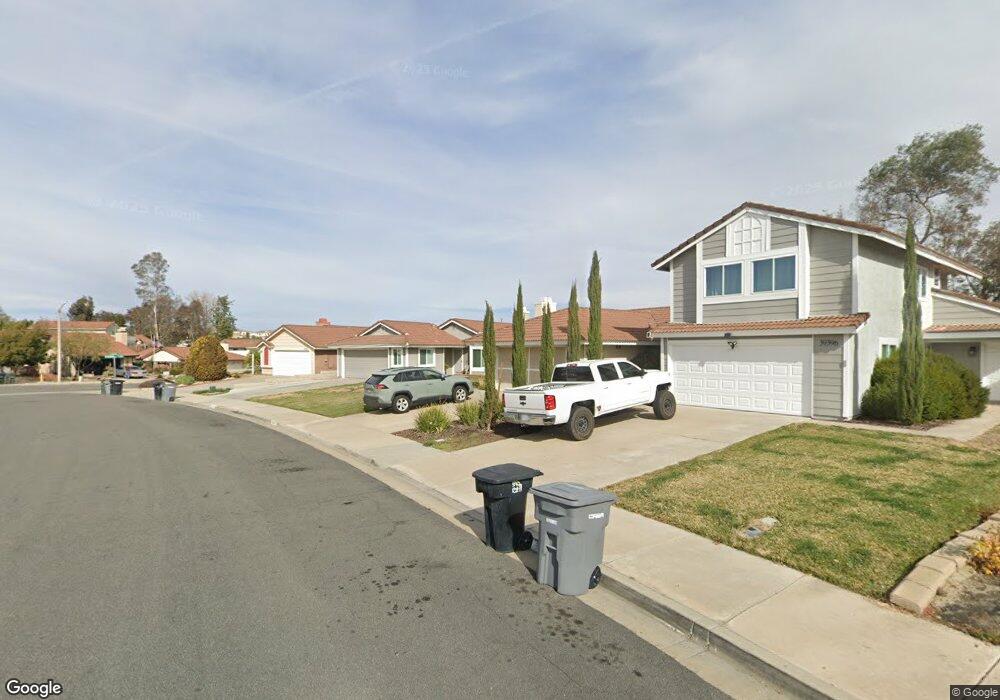
39386 Canyon Rim Cir Temecula, CA 92591
Estimated Value: $564,075 - $589,000
3
Beds
2
Baths
1,143
Sq Ft
$508/Sq Ft
Est. Value
About This Home
This home is located at 39386 Canyon Rim Cir, Temecula, CA 92591 and is currently estimated at $580,769, approximately $508 per square foot. 39386 Canyon Rim Cir is a home located in Riverside County with nearby schools including Ysabel Barnett Elementary School, James L. Day Middle School, and Chaparral High School.
Ownership History
Date
Name
Owned For
Owner Type
Purchase Details
Closed on
Jan 15, 2025
Sold by
Comstock James C and Comstock Rebecca Lee
Bought by
Comstock Family Trust and Comstock
Current Estimated Value
Purchase Details
Closed on
Jan 21, 2002
Sold by
Solberg Per H
Bought by
Comstock James C and Comstock Rebecca Lee
Home Financials for this Owner
Home Financials are based on the most recent Mortgage that was taken out on this home.
Original Mortgage
$170,500
Interest Rate
6.78%
Purchase Details
Closed on
Jun 6, 2000
Sold by
Hill Kenneth T and Hill Donna M
Bought by
Solberg Per H
Home Financials for this Owner
Home Financials are based on the most recent Mortgage that was taken out on this home.
Original Mortgage
$151,749
Interest Rate
8.53%
Mortgage Type
FHA
Purchase Details
Closed on
Feb 25, 1994
Sold by
Reza Antonio H and Reza Maria Del Carmen
Bought by
Hill Kenneth T and Hill Donna M
Home Financials for this Owner
Home Financials are based on the most recent Mortgage that was taken out on this home.
Original Mortgage
$111,690
Interest Rate
7.15%
Mortgage Type
Assumption
Create a Home Valuation Report for This Property
The Home Valuation Report is an in-depth analysis detailing your home's value as well as a comparison with similar homes in the area
Home Values in the Area
Average Home Value in this Area
Purchase History
| Date | Buyer | Sale Price | Title Company |
|---|---|---|---|
| Comstock Family Trust | -- | None Listed On Document | |
| Comstock James C | $184,000 | Commonwealth Land Title Co | |
| Solberg Per H | $153,000 | Lawyers Title Company | |
| Hill Kenneth T | $112,000 | Commonwealth Land Title |
Source: Public Records
Mortgage History
| Date | Status | Borrower | Loan Amount |
|---|---|---|---|
| Previous Owner | Comstock James C | $170,500 | |
| Previous Owner | Solberg Per H | $151,749 | |
| Previous Owner | Hill Kenneth T | $111,690 |
Source: Public Records
Tax History Compared to Growth
Tax History
| Year | Tax Paid | Tax Assessment Tax Assessment Total Assessment is a certain percentage of the fair market value that is determined by local assessors to be the total taxable value of land and additions on the property. | Land | Improvement |
|---|---|---|---|---|
| 2025 | $3,465 | $274,242 | $66,462 | $207,780 |
| 2023 | $3,465 | $263,594 | $63,882 | $199,712 |
| 2022 | $3,352 | $258,427 | $62,630 | $195,797 |
| 2021 | $3,278 | $253,360 | $61,402 | $191,958 |
| 2020 | $3,238 | $250,763 | $60,773 | $189,990 |
| 2019 | $3,189 | $245,847 | $59,582 | $186,265 |
| 2018 | $3,124 | $241,027 | $58,415 | $182,612 |
| 2017 | $3,066 | $236,302 | $57,270 | $179,032 |
| 2016 | $3,009 | $231,670 | $56,148 | $175,522 |
| 2015 | $2,955 | $228,192 | $55,305 | $172,887 |
| 2014 | $2,865 | $223,724 | $54,223 | $169,501 |
Source: Public Records
Map
Nearby Homes
- 39728 Rustic Glen Dr
- 39750 Knollridge Dr
- 39768 Creative Dr
- 39463 Napa Creek Dr
- 26921 Saint Kitts Ct
- 39780 Oak Cliff Dr
- 39848 Creative Dr
- 39293 Cayman Ct
- 39584 Cardiff Ave
- 27478 Sierra Madre Dr
- 26738 Silver Oaks Dr
- 30262 Mayacamas Dr
- 39624 Tamarisk St
- 39351 Memory Dr
- 39555 Freemark Abbey
- 39646 Freemark Abbey
- 39557 Warbler Dr
- 29441 Via la Plaza
- 39565 Torrey Pines Rd
- 39886 Worthington Place
- 39380 Canyon Rim Cir
- 39392 Canyon Rim Cir
- 27106 Rainbow Creek Dr
- 39396 Canyon Rim Cir
- 39400 Canyon Rim Cir
- 27100 Rainbow Creek Dr
- 27100 Rainbow Creek Dr
- 39383 Canyon Rim Cir
- 39395 Canyon Rim Cir
- 27115 Rainbow Creek Dr
- 39404 Canyon Rim Cir
- 27107 Rainbow Creek Dr
- 27123 Rainbow Creek Dr
- 27094 Rainbow Creek Dr
- 39403 Canyon Rim Cir
- 27099 Rainbow Creek Dr
- 27127 Rainbow Creek Dr
- 39408 Canyon Rim Cir
- 27146 Rainbow Creek Dr
- 27135 Rainbow Creek Dr