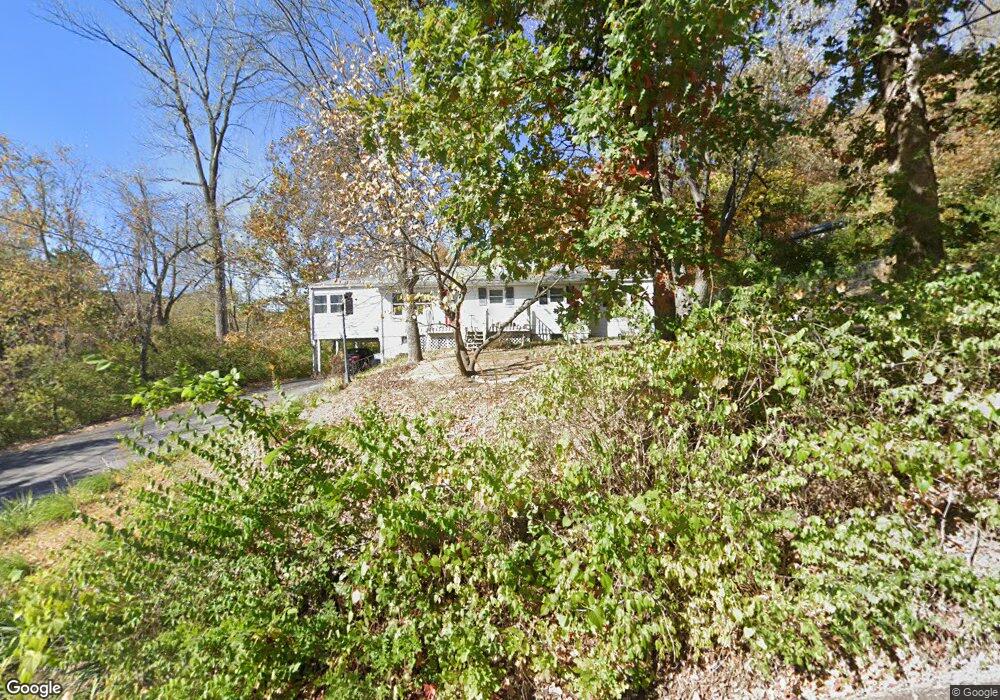
3939 E Blecha Rd Imperial, MO 63052
Estimated Value: $155,000 - $276,000
Studio
--
Bath
1,584
Sq Ft
$140/Sq Ft
Est. Value
About This Home
This home is located at 3939 E Blecha Rd, Imperial, MO 63052 and is currently estimated at $222,108, approximately $140 per square foot. 3939 E Blecha Rd is a home located in Jefferson County with nearby schools including Clyde Hamrick Elementary School, Antonia Middle School, and Seckman Senior High School.
Ownership History
Date
Name
Owned For
Owner Type
Purchase Details
Closed on
Nov 5, 2015
Sold by
Robison Susan C
Bought by
Robison Susan C and Robison Ernest L
Current Estimated Value
Purchase Details
Closed on
Jun 13, 2012
Sold by
Robison Susan C and Robison Ernest L
Bought by
Robison Susan C
Home Financials for this Owner
Home Financials are based on the most recent Mortgage that was taken out on this home.
Original Mortgage
$89,650
Outstanding Balance
$13,271
Interest Rate
3.8%
Mortgage Type
New Conventional
Estimated Equity
$208,837
Purchase Details
Closed on
Jan 5, 2009
Sold by
Robison Susan C
Bought by
Robison Susan C and Robison Ernest L
Purchase Details
Closed on
Jul 29, 1997
Sold by
Scullin John C & Joann Trustees
Bought by
Robison Susan C
Home Financials for this Owner
Home Financials are based on the most recent Mortgage that was taken out on this home.
Original Mortgage
$95,900
Interest Rate
7.25%
Mortgage Type
Assumption
Create a Home Valuation Report for This Property
The Home Valuation Report is an in-depth analysis detailing your home's value as well as a comparison with similar homes in the area
Home Values in the Area
Average Home Value in this Area
Purchase History
| Date | Buyer | Sale Price | Title Company |
|---|---|---|---|
| Robison Susan C | -- | None Available | |
| Robison Susan C | -- | Touchstone Title & Abstract | |
| Robison Susan C | -- | None Available | |
| Robison Susan C | -- | Commonwealth Title |
Source: Public Records
Mortgage History
| Date | Status | Borrower | Loan Amount |
|---|---|---|---|
| Open | Robison Susan C | $89,650 | |
| Closed | Robison Susan C | $95,900 |
Source: Public Records
Tax History
| Year | Tax Paid | Tax Assessment Tax Assessment Total Assessment is a certain percentage of the fair market value that is determined by local assessors to be the total taxable value of land and additions on the property. | Land | Improvement |
|---|---|---|---|---|
| 2025 | $1,400 | $20,900 | $1,500 | $19,400 |
| 2024 | $1,400 | $19,100 | $1,500 | $17,600 |
| 2023 | $1,400 | $20,600 | $1,500 | $19,100 |
| 2022 | $1,512 | $20,600 | $1,500 | $19,100 |
| 2021 | $1,511 | $20,600 | $1,500 | $19,100 |
| 2020 | $1,434 | $18,400 | $1,200 | $17,200 |
| 2019 | $1,435 | $18,400 | $1,200 | $17,200 |
| 2018 | $1,384 | $17,800 | $1,200 | $16,600 |
| 2017 | $1,342 | $17,800 | $1,200 | $16,600 |
| 2016 | $1,291 | $17,200 | $1,800 | $15,400 |
Source: Public Records
Map
Nearby Homes
- 3835 Miller Valley Dr
- 3700 Pioneer Dr
- 5270 Jimmy Dr
- 3448 Helena Acres Dr
- 12 Ozark Ln
- 2609 Jessica Trail
- 3512 E Rock Creek Rd
- 3179 Quiet Forest Dr
- 4655 Blue Springs Dr
- 3375 Old Sugar Creek Rd
- 5360 Amber Meadows Dr
- 844 Konert Hill Dr
- 4026 Amberleigh Pkwy
- 4183 Konder Dr
- 1 Quincy @ Arlington Heights
- 1531 Arlington Heights Way
- 1311 Timber Creek Ln
- 4600 Annandale Ave
- 1 Sydney @ Arlington Heights
- 1 Savoy @ Arlington Heights
- 3821 E Blecha Rd
- 3941 E Blecha Rd
- 3938 E Blecha Rd
- 3942 E Blecha Rd
- 3822 E Blecha Rd
- 3945 Old State Route 21
- 3810 E Blecha Rd
- 3940 Old State Route 21
- 3934 Old State Route 21
- 3944 Old State Route 21
- 3993 Valley Dr
- 3800 E Blecha Rd
- 3813 Mystic Valley Dr
- 3935 Valley Dr
- 3811 Mystic Valley Dr
- 3950 Frog Pond Rd
- 3815 Mystic Valley Dr
- 3805 Mystic Valley Dr
- 3931 Valley Dr
- 3755 Lower Rd
Your Personal Tour Guide
Ask me questions while you tour the home.