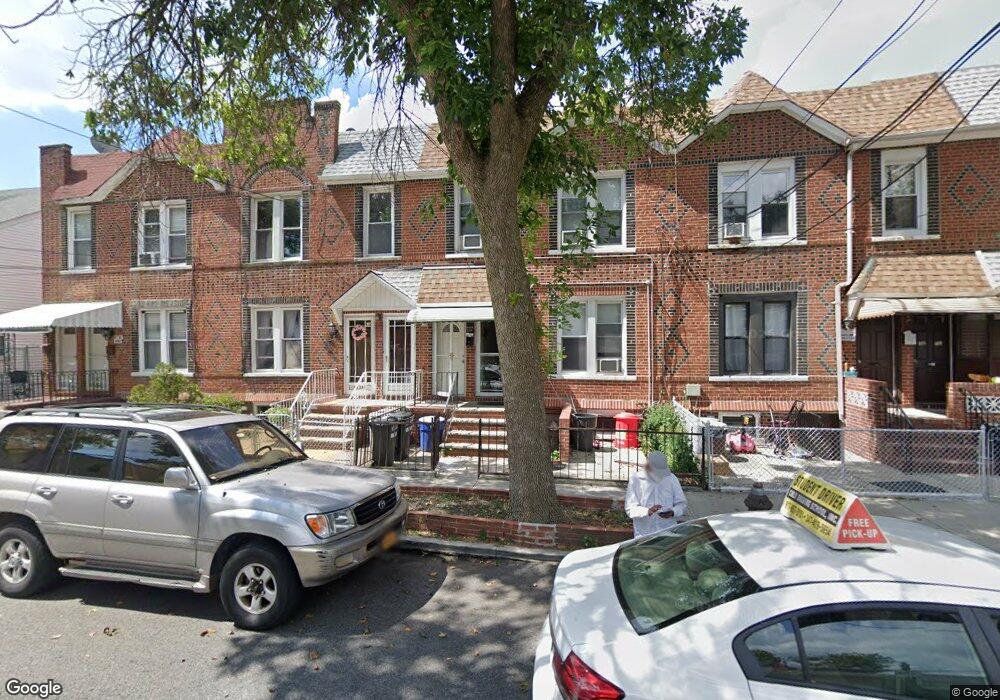
394 Drew St Brooklyn, NY 11208
East New York NeighborhoodEstimated Value: $344,000 - $978,000
--
Bed
--
Bath
2,136
Sq Ft
$365/Sq Ft
Est. Value
About This Home
This home is located at 394 Drew St, Brooklyn, NY 11208 and is currently estimated at $780,067, approximately $365 per square foot. 394 Drew St is a home located in Kings County with nearby schools including P.S. 214 - Michael Friedsam, Cypress Hills Ascend Charter Lower School, and Blessed Sacrament School.
Ownership History
Date
Name
Owned For
Owner Type
Purchase Details
Closed on
Mar 1, 2021
Sold by
Zaman Sohail A
Bought by
394 Drew St Corp
Current Estimated Value
Purchase Details
Closed on
Oct 8, 2012
Sold by
Mohammed Shazu
Bought by
Zaman Sohail A
Purchase Details
Closed on
Feb 11, 2011
Sold by
Erwin Scheppke As Proposed Executor and Estate Of Angelina Montesano
Bought by
Mohammed Shazu
Home Financials for this Owner
Home Financials are based on the most recent Mortgage that was taken out on this home.
Original Mortgage
$334,304
Interest Rate
5.07%
Mortgage Type
Purchase Money Mortgage
Purchase Details
Closed on
Feb 26, 2002
Sold by
Montesano Angelina Heir and Rosa Anna Della
Bought by
Montesano Angelina
Home Financials for this Owner
Home Financials are based on the most recent Mortgage that was taken out on this home.
Original Mortgage
$55,000
Interest Rate
6.88%
Mortgage Type
Purchase Money Mortgage
Create a Home Valuation Report for This Property
The Home Valuation Report is an in-depth analysis detailing your home's value as well as a comparison with similar homes in the area
Home Values in the Area
Average Home Value in this Area
Purchase History
| Date | Buyer | Sale Price | Title Company |
|---|---|---|---|
| 394 Drew St Corp | $290,000 | -- | |
| Zaman Sohail A | -- | -- | |
| Mohammed Shazu | $360,400 | -- | |
| Montesano Angelina | -- | -- |
Source: Public Records
Mortgage History
| Date | Status | Borrower | Loan Amount |
|---|---|---|---|
| Previous Owner | Mohammed Shazu | $334,304 | |
| Previous Owner | Montesano Angelina | $55,000 |
Source: Public Records
Tax History Compared to Growth
Tax History
| Year | Tax Paid | Tax Assessment Tax Assessment Total Assessment is a certain percentage of the fair market value that is determined by local assessors to be the total taxable value of land and additions on the property. | Land | Improvement |
|---|---|---|---|---|
| 2025 | $6,992 | $59,400 | $17,040 | $42,360 |
| 2024 | $6,992 | $56,640 | $17,040 | $39,600 |
| 2023 | $6,670 | $56,160 | $17,040 | $39,120 |
| 2022 | $6,416 | $51,960 | $17,040 | $34,920 |
| 2021 | $6,764 | $40,140 | $17,040 | $23,100 |
| 2020 | $3,217 | $41,820 | $17,040 | $24,780 |
| 2019 | $6,069 | $41,820 | $17,040 | $24,780 |
| 2018 | $5,579 | $27,370 | $13,589 | $13,781 |
| 2017 | $5,460 | $26,784 | $15,092 | $11,692 |
| 2016 | $5,354 | $26,784 | $13,487 | $13,297 |
| 2015 | $2,828 | $25,627 | $15,052 | $10,575 |
| 2014 | $2,828 | $24,177 | $16,608 | $7,569 |
Source: Public Records
Map
Nearby Homes