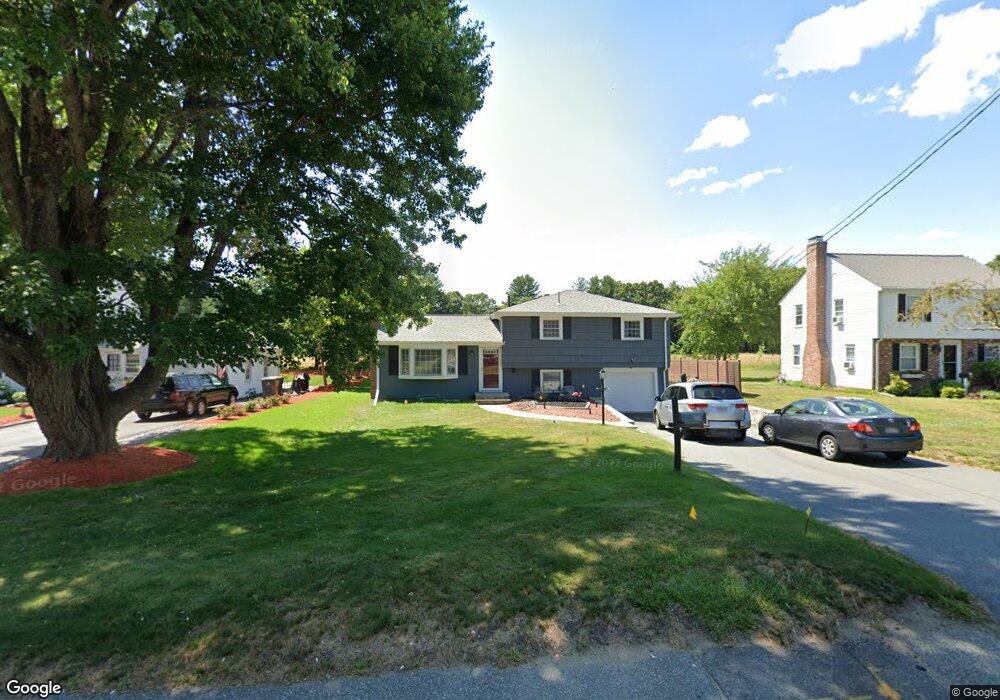
394 Edgell Rd Framingham, MA 01701
Nobscot NeighborhoodEstimated Value: $599,593 - $764,000
3
Beds
2
Baths
1,130
Sq Ft
$582/Sq Ft
Est. Value
About This Home
This home is located at 394 Edgell Rd, Framingham, MA 01701 and is currently estimated at $658,148, approximately $582 per square foot. 394 Edgell Rd is a home located in Middlesex County with nearby schools including Framingham High School, Summit Montessori School, and Saint Bridget School.
Ownership History
Date
Name
Owned For
Owner Type
Purchase Details
Closed on
Oct 24, 2023
Sold by
Beach Michael C and Beach Julie C
Bought by
Michael Beach T and Beach
Current Estimated Value
Purchase Details
Closed on
Jun 29, 1992
Sold by
Hoyland Raymond K and Comeau Jeanne D
Bought by
Beach Michael C and Beach Julie C
Purchase Details
Closed on
Jul 9, 1991
Sold by
Todisco Barbara J
Bought by
Hoyland Raymond K and Hoyland Jeanne Comeau
Create a Home Valuation Report for This Property
The Home Valuation Report is an in-depth analysis detailing your home's value as well as a comparison with similar homes in the area
Home Values in the Area
Average Home Value in this Area
Purchase History
| Date | Buyer | Sale Price | Title Company |
|---|---|---|---|
| Michael Beach T | -- | None Available | |
| Michael Beach T | -- | None Available | |
| Beach Michael C | $165,000 | -- | |
| Beach Michael C | $165,000 | -- | |
| Hoyland Raymond K | $117,400 | -- | |
| Hoyland Raymond K | $117,400 | -- |
Source: Public Records
Mortgage History
| Date | Status | Borrower | Loan Amount |
|---|---|---|---|
| Previous Owner | Hoyland Raymond K | $209,600 | |
| Previous Owner | Hoyland Raymond K | $20,000 | |
| Previous Owner | Hoyland Raymond K | $153,000 |
Source: Public Records
Tax History
| Year | Tax Paid | Tax Assessment Tax Assessment Total Assessment is a certain percentage of the fair market value that is determined by local assessors to be the total taxable value of land and additions on the property. | Land | Improvement |
|---|---|---|---|---|
| 2025 | $6,506 | $544,900 | $263,000 | $281,900 |
| 2024 | $6,142 | $492,900 | $234,900 | $258,000 |
| 2023 | $5,800 | $443,100 | $209,700 | $233,400 |
| 2022 | $5,462 | $397,500 | $190,200 | $207,300 |
| 2021 | $5,359 | $381,400 | $182,900 | $198,500 |
| 2020 | $5,310 | $354,500 | $166,200 | $188,300 |
| 2019 | $5,252 | $341,500 | $166,200 | $175,300 |
| 2018 | $5,173 | $317,000 | $160,000 | $157,000 |
| 2017 | $5,006 | $299,600 | $155,300 | $144,300 |
| 2016 | $4,839 | $278,400 | $155,300 | $123,100 |
| 2015 | $4,706 | $264,100 | $155,300 | $108,800 |
Source: Public Records
Map
Nearby Homes
- 484 Edgell Rd
- 51 Woodland Dr
- 102 Spruce St
- 2 Grove St
- 5 Lavelle Ln
- 32 Lyman Rd
- 11 Bellwood Way
- 44 Agnes Dr
- 1186 Worcester Rd Unit 610
- 139 Salem End Rd
- 18 Eagle Ln Unit 21
- 1321 Worcester Rd Unit 603
- 1321 Worcester Rd Unit 610
- 575 Union Ave Unit 1
- 2 Hemenway Rd
- 111 Indian Head Rd
- 907 Windsor Dr
- 301 Windsor Dr
- 2 Chesterfield St
- 356 Central St
Your Personal Tour Guide
Ask me questions while you tour the home.