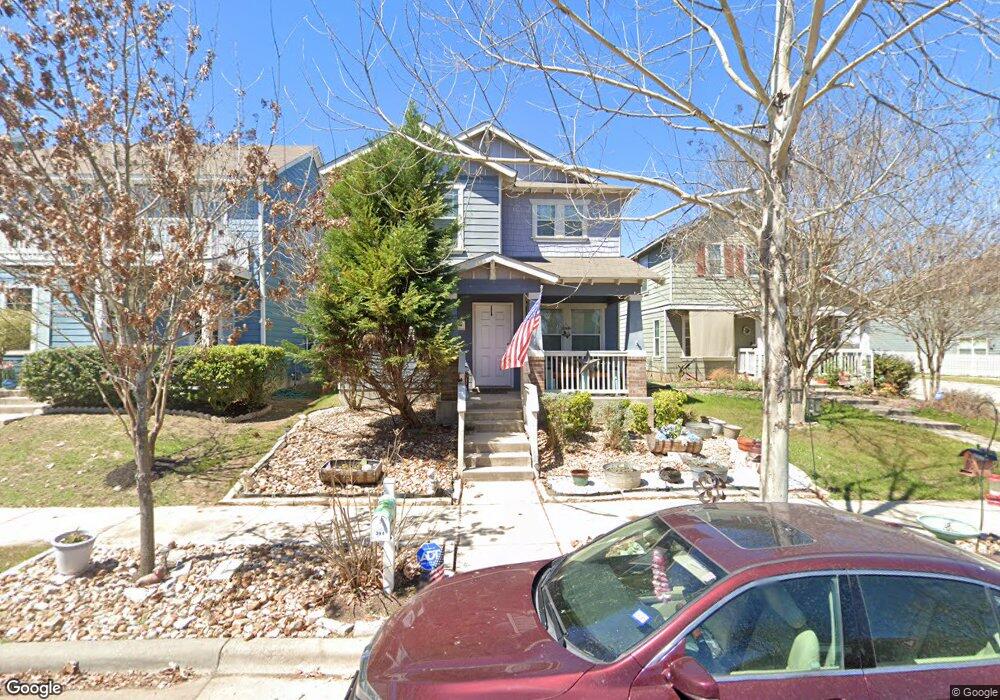
394 Mcgarity Kyle, TX 78640
Plum Creek NeighborhoodEstimated Value: $283,237 - $358,000
Studio
--
Bath
1,584
Sq Ft
$204/Sq Ft
Est. Value
About This Home
This home is located at 394 Mcgarity, Kyle, TX 78640 and is currently estimated at $323,559, approximately $204 per square foot. 394 Mcgarity is a home located in Hays County with nearby schools including Laura B Negley Elementary School, R C Barton Middle School, and Jack C Hays High School.
Ownership History
Date
Name
Owned For
Owner Type
Purchase Details
Closed on
Oct 28, 2010
Sold by
Kb Home Lone Star Inc
Bought by
Gammon Barbara
Current Estimated Value
Home Financials for this Owner
Home Financials are based on the most recent Mortgage that was taken out on this home.
Original Mortgage
$153,375
Outstanding Balance
$101,658
Interest Rate
4.36%
Mortgage Type
FHA
Estimated Equity
$221,901
Purchase Details
Closed on
Jun 24, 2010
Sold by
Plum Creek Development Partners Ltd
Bought by
Kb Home Lone Star Inc
Create a Home Valuation Report for This Property
The Home Valuation Report is an in-depth analysis detailing your home's value as well as a comparison with similar homes in the area
Home Values in the Area
Average Home Value in this Area
Purchase History
| Date | Buyer | Sale Price | Title Company |
|---|---|---|---|
| Gammon Barbara | -- | Alamo Title | |
| Kb Home Lone Star Inc | -- | Alamo Title |
Source: Public Records
Mortgage History
| Date | Status | Borrower | Loan Amount |
|---|---|---|---|
| Open | Gammon Barbara | $153,375 |
Source: Public Records
Tax History
| Year | Tax Paid | Tax Assessment Tax Assessment Total Assessment is a certain percentage of the fair market value that is determined by local assessors to be the total taxable value of land and additions on the property. | Land | Improvement |
|---|---|---|---|---|
| 2025 | $3,712 | $315,950 | $70,800 | $245,150 |
| 2024 | $69 | $304,170 | $70,800 | $233,370 |
| 2023 | $6,700 | $299,923 | $88,500 | $258,280 |
| 2022 | $6,636 | $272,657 | $75,000 | $270,100 |
| 2021 | $6,577 | $247,870 | $39,200 | $208,670 |
| 2019 | $6,051 | $219,040 | $29,400 | $189,640 |
| 2018 | $5,829 | $210,460 | $21,000 | $189,460 |
| 2017 | $5,520 | $195,822 | $21,000 | $181,780 |
| 2016 | $5,018 | $178,020 | $21,000 | $157,020 |
| 2015 | $3,937 | $165,891 | $21,000 | $153,280 |
Source: Public Records
Map
Nearby Homes
Your Personal Tour Guide
Ask me questions while you tour the home.