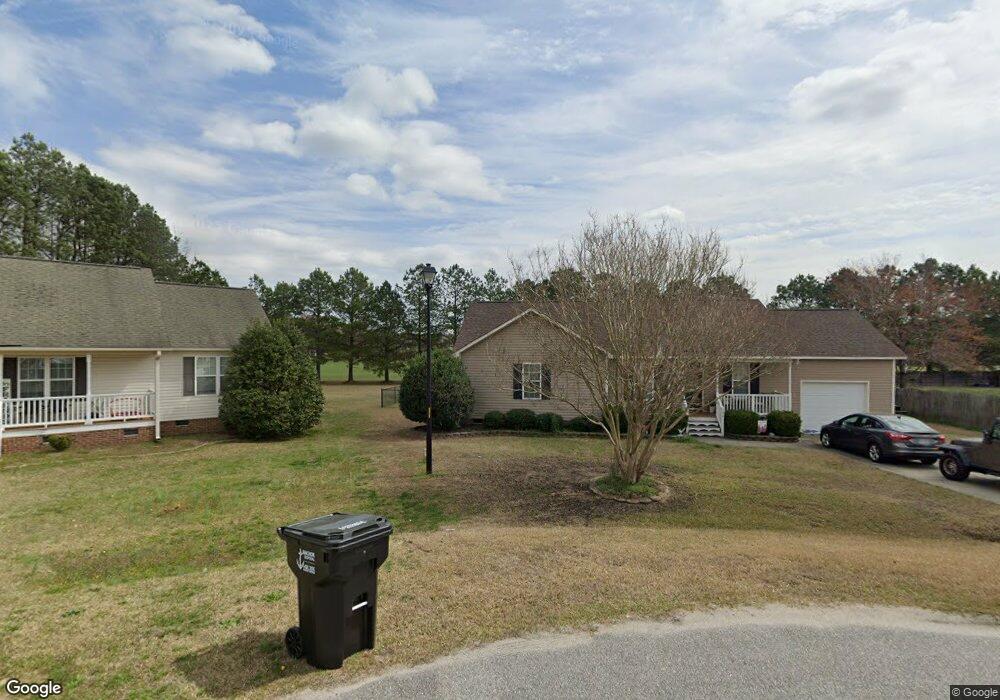
394 Middle Landing Dr Unit 24 Smithfield, NC 27577
Estimated Value: $279,130 - $303,000
3
Beds
2
Baths
1,254
Sq Ft
$233/Sq Ft
Est. Value
About This Home
This home is located at 394 Middle Landing Dr Unit 24, Smithfield, NC 27577 and is currently estimated at $292,783, approximately $233 per square foot. 394 Middle Landing Dr Unit 24 is a home located in Johnston County with nearby schools including West Smithfield Elementary School, Swift Creek Middle, and Cleveland High School.
Ownership History
Date
Name
Owned For
Owner Type
Purchase Details
Closed on
Mar 28, 2014
Sold by
Vause Justin R and Vause May
Bought by
Plato Cathryn A
Current Estimated Value
Home Financials for this Owner
Home Financials are based on the most recent Mortgage that was taken out on this home.
Original Mortgage
$134,591
Outstanding Balance
$102,545
Interest Rate
4.4%
Mortgage Type
New Conventional
Estimated Equity
$190,238
Purchase Details
Closed on
Jun 19, 2008
Sold by
Darryl D Evans Inc
Bought by
Vause Justin R and Whitman Amy
Home Financials for this Owner
Home Financials are based on the most recent Mortgage that was taken out on this home.
Original Mortgage
$125,860
Interest Rate
6.08%
Mortgage Type
FHA
Purchase Details
Closed on
Apr 1, 2008
Sold by
Gfg Properties Llc
Bought by
Darryl D Evans Inc
Create a Home Valuation Report for This Property
The Home Valuation Report is an in-depth analysis detailing your home's value as well as a comparison with similar homes in the area
Home Values in the Area
Average Home Value in this Area
Purchase History
| Date | Buyer | Sale Price | Title Company |
|---|---|---|---|
| Plato Cathryn A | $132,000 | None Available | |
| Vause Justin R | $132,000 | None Available | |
| Darryl D Evans Inc | $85,500 | None Available |
Source: Public Records
Mortgage History
| Date | Status | Borrower | Loan Amount |
|---|---|---|---|
| Open | Plato Cathryn A | $134,591 | |
| Previous Owner | Vause Justin R | $125,860 |
Source: Public Records
Tax History Compared to Growth
Tax History
| Year | Tax Paid | Tax Assessment Tax Assessment Total Assessment is a certain percentage of the fair market value that is determined by local assessors to be the total taxable value of land and additions on the property. | Land | Improvement |
|---|---|---|---|---|
| 2025 | $1,783 | $280,850 | $70,000 | $210,850 |
| 2024 | $1,221 | $150,680 | $32,000 | $118,680 |
| 2023 | $1,160 | $150,680 | $32,000 | $118,680 |
| 2022 | $1,190 | $150,680 | $32,000 | $118,680 |
| 2021 | $1,190 | $150,680 | $32,000 | $118,680 |
| 2020 | $1,236 | $150,680 | $32,000 | $118,680 |
| 2019 | $1,236 | $150,680 | $32,000 | $118,680 |
| 2018 | $1,090 | $129,810 | $28,500 | $101,310 |
| 2017 | $1,090 | $129,810 | $28,500 | $101,310 |
| 2016 | $1,090 | $129,810 | $28,500 | $101,310 |
| 2015 | $1,090 | $129,810 | $28,500 | $101,310 |
| 2014 | $1,090 | $129,810 | $28,500 | $101,310 |
Source: Public Records
Map
Nearby Homes
- 223 Shiloh Woods Cir
- 50 Shiloh Woods Cir
- 20 Shiloh Woods Cir
- 2222 Crantock Rd
- 205 Shiloh Woods Cir
- 142 Boss Shot Dr
- 189 Gobbler Dr
- 122 Boss Shot Dr
- 74 Dr
- 140 Gobbler Dr
- 48 Spirit Springs Rd
- Plan 2723 at Turkey Ridge
- Plan 2539 at Turkey Ridge
- Plan 1910 Modeled at Turkey Ridge
- Plan 1446 at Turkey Ridge
- Plan 2939 at Turkey Ridge
- Plan 2338 at Turkey Ridge
- Plan 2115 at Turkey Ridge
- Plan 1773 at Turkey Ridge
- 122 Spirit Springs Rd
- 394 Middle Landing Dr
- 398 Middle Landing Dr
- 378 Middle Landing Dr
- 360 Middle Landing Dr
- 399 Middle Landing Dr
- 401 Middle Landing Dr
- 391 Middle Landing Dr
- 375 Middle Landing Dr
- 375 Middle Landing Dr Unit 29
- 347 Middle Landing Dr
- 342 Middle Landing Dr
- 1569 Crantock Rd
- 324 Middle Landing Dr
- 315 Middle Landing Dr
- 77 Burke Ct
- 76 Burke Ct
- 310 Middle Landing Dr
- 285 Middle Landing Dr
- 285 Middle Landing Dr Unit 32
- 292 Middle Landing Dr