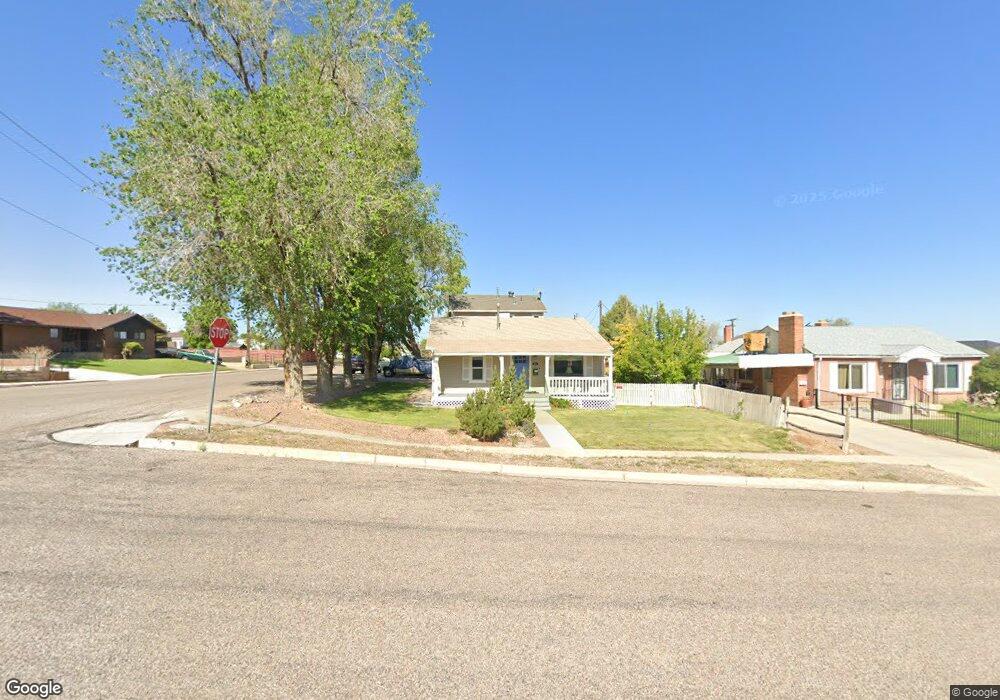
394 S 300 E Cedar City, UT 84720
Estimated Value: $243,000 - $350,000
2
Beds
1
Bath
927
Sq Ft
$316/Sq Ft
Est. Value
About This Home
This home is located at 394 S 300 E, Cedar City, UT 84720 and is currently estimated at $292,642, approximately $315 per square foot. 394 S 300 E is a home located in Iron County with nearby schools including Cedar East School, Cedar Middle School, and Cedar City High School.
Ownership History
Date
Name
Owned For
Owner Type
Purchase Details
Closed on
Nov 1, 2012
Sold by
Hill Charles and Hill Helen Sue
Bought by
Hill Helen Sue and Hill Charles Melton
Current Estimated Value
Purchase Details
Closed on
Aug 15, 2007
Sold by
Phillips Leslie B
Bought by
Hill Charles and Hill Helen Sue
Purchase Details
Closed on
Nov 1, 2005
Sold by
Image Academy Of Cosmetology Limited Llc
Bought by
Phillips Leslie B
Home Financials for this Owner
Home Financials are based on the most recent Mortgage that was taken out on this home.
Original Mortgage
$101,200
Interest Rate
5.9%
Mortgage Type
New Conventional
Create a Home Valuation Report for This Property
The Home Valuation Report is an in-depth analysis detailing your home's value as well as a comparison with similar homes in the area
Home Values in the Area
Average Home Value in this Area
Purchase History
| Date | Buyer | Sale Price | Title Company |
|---|---|---|---|
| Hill Helen Sue | -- | None Available | |
| Hill Charles | -- | -- | |
| Phillips Leslie B | -- | -- |
Source: Public Records
Mortgage History
| Date | Status | Borrower | Loan Amount |
|---|---|---|---|
| Previous Owner | Phillips Leslie B | $101,200 |
Source: Public Records
Tax History
| Year | Tax Paid | Tax Assessment Tax Assessment Total Assessment is a certain percentage of the fair market value that is determined by local assessors to be the total taxable value of land and additions on the property. | Land | Improvement |
|---|---|---|---|---|
| 2025 | $1,101 | $141,575 | $30,582 | $110,993 |
| 2023 | $1,102 | $134,890 | $30,580 | $104,310 |
| 2022 | $1,080 | $117,505 | $30,580 | $86,925 |
| 2021 | $936 | $101,830 | $14,560 | $87,270 |
| 2020 | $885 | $85,405 | $14,560 | $70,845 |
| 2019 | $782 | $72,170 | $14,560 | $57,610 |
| 2018 | $809 | $72,170 | $14,560 | $57,610 |
| 2017 | $680 | $59,705 | $12,590 | $47,115 |
| 2016 | $723 | $59,120 | $12,005 | $47,115 |
| 2015 | $729 | $56,580 | $0 | $0 |
| 2014 | $695 | $50,460 | $0 | $0 |
Source: Public Records
Map
Nearby Homes
- 334 S 400 E Unit 2
- 314 S 200 E
- 102 E 400 S
- 189 S 400 E
- 252 E Altamira Dr
- 95 S 200 E
- 42 S 400 E
- 0 Hwy 14 Unit 23-243193
- 642 S Sunset Dr
- 680 S 75 E
- 84 N Highland Dr
- 160 E Mcarthur Ave
- 9 E 820 S
- 857 S 25 E
- 475 E Parkway Dr
- 922 S 25 W
- 6100 W 200 S
- 252 N Highland Dr
- 920 S 25 E Unit 17 G
- 920 S 25 E Unit 10C
Your Personal Tour Guide
Ask me questions while you tour the home.