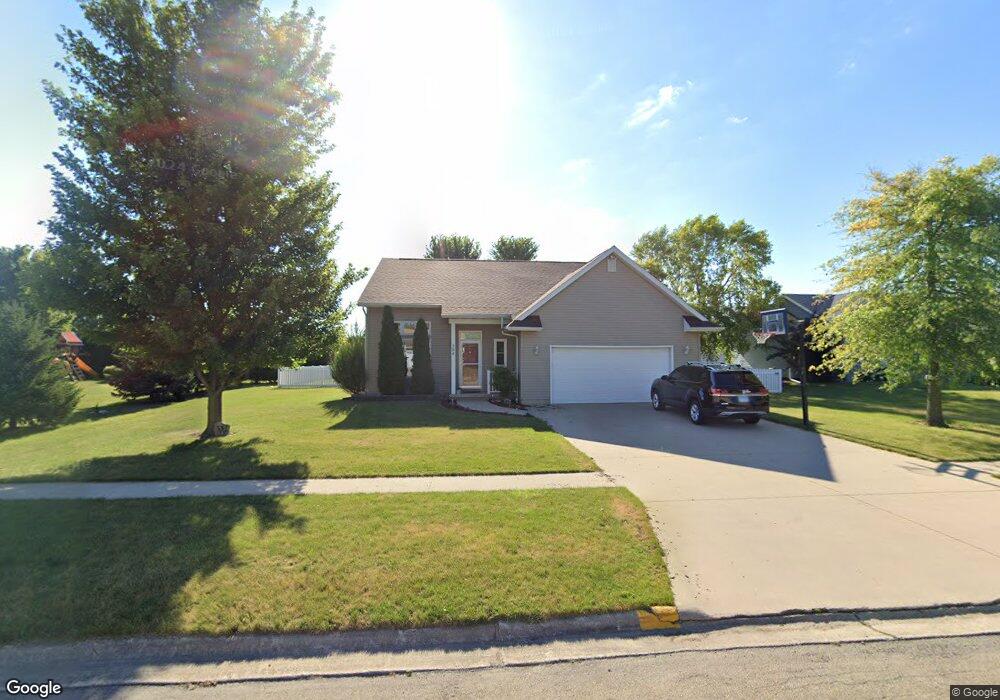
394 Willow St Herscher, IL 60941
Estimated Value: $252,000 - $310,398
4
Beds
3
Baths
2,170
Sq Ft
$135/Sq Ft
Est. Value
About This Home
This home is located at 394 Willow St, Herscher, IL 60941 and is currently estimated at $292,100, approximately $134 per square foot. 394 Willow St is a home located in Kankakee County with nearby schools including Herscher High School.
Ownership History
Date
Name
Owned For
Owner Type
Purchase Details
Closed on
Sep 13, 2021
Sold by
Mary J Sherill Trust
Bought by
Weidner Mark S and Manzella Jessica M
Current Estimated Value
Home Financials for this Owner
Home Financials are based on the most recent Mortgage that was taken out on this home.
Original Mortgage
$215,100
Outstanding Balance
$196,300
Interest Rate
3%
Mortgage Type
New Conventional
Estimated Equity
$95,800
Purchase Details
Closed on
Mar 15, 2021
Sold by
Jean Sherrill Mary
Bought by
Mary J Sherrill Trust
Purchase Details
Closed on
Jun 10, 2015
Sold by
Berger Kenneth B and Berger Amanda M
Bought by
Sherrill Mary J
Home Financials for this Owner
Home Financials are based on the most recent Mortgage that was taken out on this home.
Original Mortgage
$153,600
Interest Rate
3.65%
Mortgage Type
New Conventional
Create a Home Valuation Report for This Property
The Home Valuation Report is an in-depth analysis detailing your home's value as well as a comparison with similar homes in the area
Home Values in the Area
Average Home Value in this Area
Purchase History
| Date | Buyer | Sale Price | Title Company |
|---|---|---|---|
| Weidner Mark S | $239,000 | Kankakee County Title | |
| Mary J Sherrill Trust | -- | Ann L Brezinski Law Office Llc | |
| Sherrill Mary J | $192,000 | Kankakee Cnty Title & Tr |
Source: Public Records
Mortgage History
| Date | Status | Borrower | Loan Amount |
|---|---|---|---|
| Open | Weidner Mark S | $215,100 | |
| Previous Owner | Sherrill Mary J | $153,600 |
Source: Public Records
Tax History Compared to Growth
Tax History
| Year | Tax Paid | Tax Assessment Tax Assessment Total Assessment is a certain percentage of the fair market value that is determined by local assessors to be the total taxable value of land and additions on the property. | Land | Improvement |
|---|---|---|---|---|
| 2024 | $5,549 | $82,084 | $13,958 | $68,126 |
| 2023 | $5,203 | $75,647 | $12,864 | $62,783 |
| 2022 | $4,942 | $70,492 | $11,988 | $58,504 |
| 2021 | $4,422 | $66,982 | $11,391 | $55,591 |
| 2020 | $4,301 | $64,717 | $11,006 | $53,711 |
| 2019 | $4,149 | $62,529 | $10,634 | $51,895 |
| 2018 | $4,099 | $61,757 | $10,503 | $51,254 |
| 2017 | $3,979 | $60,104 | $10,222 | $49,882 |
| 2016 | $3,792 | $57,792 | $9,829 | $47,963 |
| 2015 | $3,618 | $54,884 | $9,335 | $45,549 |
| 2014 | $3,710 | $53,285 | $9,063 | $44,222 |
| 2013 | -- | $54,234 | $9,224 | $45,010 |
Source: Public Records
Map
Nearby Homes
- 464 E Pilot Dr
- 35 E Tobey Dr
- 597 Jeanette St
- 688 Jeanette St
- 587 Jeanette St
- 678 Jeanette St
- 476 E Kay St
- 577 Jeanette St
- 567 Jeanette St
- 473 E Kay St
- 301 N Main St
- 547 Jeanette St
- 431/441 E Myrtle Ave
- 537 Jeanette St
- 343 E Walnut Ct
- 477 Jeanette St
- 467 Jeanette St
- 457 Jeanette St
- 437 Jeanette St
- 407 Jeanette St