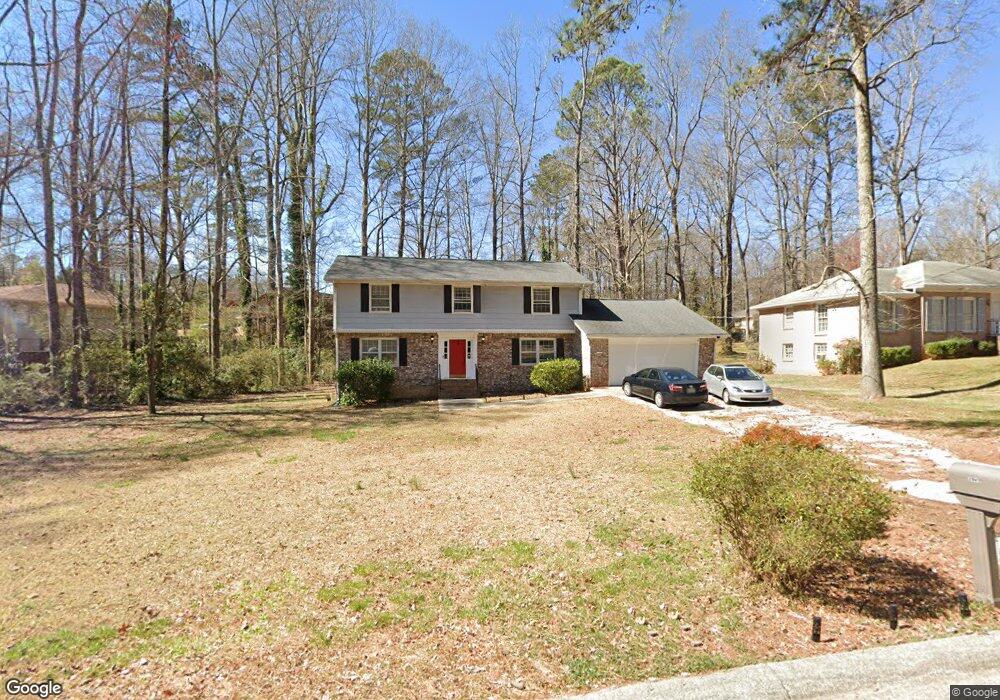
3940 Cloudland Dr SE Unit 6 Smyrna, GA 30082
Estimated Value: $455,000 - $547,000
4
Beds
3
Baths
2,319
Sq Ft
$211/Sq Ft
Est. Value
About This Home
This home is located at 3940 Cloudland Dr SE Unit 6, Smyrna, GA 30082 and is currently estimated at $489,629, approximately $211 per square foot. 3940 Cloudland Dr SE Unit 6 is a home located in Cobb County with nearby schools including King Springs Elementary School, Griffin Middle School, and Campbell High School.
Ownership History
Date
Name
Owned For
Owner Type
Purchase Details
Closed on
Aug 25, 2000
Sold by
Sullivan Stanley R
Bought by
Whatley Michael D and Whatley Roy A
Current Estimated Value
Home Financials for this Owner
Home Financials are based on the most recent Mortgage that was taken out on this home.
Original Mortgage
$117,600
Outstanding Balance
$42,490
Interest Rate
8.17%
Mortgage Type
New Conventional
Estimated Equity
$447,139
Purchase Details
Closed on
Dec 9, 1996
Sold by
Secretary Of Va
Bought by
Mack Freddie
Purchase Details
Closed on
Nov 7, 1995
Sold by
Mtgco Bancboston
Bought by
Secretary Of Va
Purchase Details
Closed on
Mar 24, 1994
Sold by
Millson Scott A Kristin F
Bought by
White William J Jessie
Home Financials for this Owner
Home Financials are based on the most recent Mortgage that was taken out on this home.
Original Mortgage
$118,830
Interest Rate
7%
Mortgage Type
VA
Create a Home Valuation Report for This Property
The Home Valuation Report is an in-depth analysis detailing your home's value as well as a comparison with similar homes in the area
Home Values in the Area
Average Home Value in this Area
Purchase History
| Date | Buyer | Sale Price | Title Company |
|---|---|---|---|
| Whatley Michael D | $147,000 | -- | |
| Mack Freddie | $132,100 | -- | |
| Secretary Of Va | -- | -- | |
| Mtgco Bancboston | $105,252 | -- | |
| White William J Jessie | $116,500 | -- |
Source: Public Records
Mortgage History
| Date | Status | Borrower | Loan Amount |
|---|---|---|---|
| Open | Whatley Michael D | $117,600 | |
| Previous Owner | White William J Jessie | $118,830 | |
| Closed | Mack Freddie | $0 |
Source: Public Records
Tax History Compared to Growth
Tax History
| Year | Tax Paid | Tax Assessment Tax Assessment Total Assessment is a certain percentage of the fair market value that is determined by local assessors to be the total taxable value of land and additions on the property. | Land | Improvement |
|---|---|---|---|---|
| 2025 | $6,562 | $241,620 | $40,000 | $201,620 |
| 2024 | $3,129 | $115,200 | $28,000 | $87,200 |
| 2023 | $3,129 | $115,200 | $28,000 | $87,200 |
| 2022 | $3,982 | $145,536 | $28,000 | $117,536 |
| 2021 | $3,134 | $114,000 | $28,000 | $86,000 |
| 2020 | $3,346 | $121,708 | $28,000 | $93,708 |
| 2019 | $2,409 | $87,628 | $24,000 | $63,628 |
| 2018 | $2,291 | $83,324 | $24,000 | $59,324 |
| 2017 | $2,149 | $83,324 | $24,000 | $59,324 |
| 2016 | $2,149 | $83,324 | $24,000 | $59,324 |
| 2015 | $2,047 | $77,536 | $24,000 | $53,536 |
| 2014 | $2,066 | $77,536 | $0 | $0 |
Source: Public Records
Map
Nearby Homes
- 418 Mockingbird Ln SE
- 317 Highview Dr SE
- 524 Tackett Farms Rd
- 362 Doeskin Ln SE
- 3933 N Cooper Lake Rd SE
- 465 Willowbrook Dr SE
- 3808 Concord Approach Way SE
- 576 N Thomas Ln SE
- 203 Angla Dr SE
- 4135 Fawn Ln SE
- 4195 Antler Trail SE
- 436 Concord Rd SE
- 4246 Antler Trail SE
- 3910 W Cooper Lake Dr SE
- 1522 Grace Meadows Ln SE
- 538 Micayne Cir SE Unit 3
- 3844 Lake Dr SE
- 3928 Cloudland Dr SE
- 405 Willowbrook Dr SE
- 395 Willowbrook Dr SE Unit 4
- 3937 Cloudland Dr SE
- 3914 Cloudland Dr SE
- 389 Willowbrook Dr SE
- 3945 Cloudland Dr SE
- 3923 Cloudland Dr SE Unit 4
- 3961 Cloudland Dr SE
- 394 Lynhurst Rd SE
- 377 Willowbrook Dr SE
- 3907 Cloudland Dr SE
- 400 Willowbrook Dr SE
- 390 Willowbrook Dr SE
- 410 Willowbrook Dr SE Unit 6
- 3902 Cloudland Dr SE
- 406 Lynhurst Rd SE
- 4061 Plumcrest Cir SE
- 0 Cloudland Dr Unit 7445057
- 0 Cloudland Dr Unit 7451827