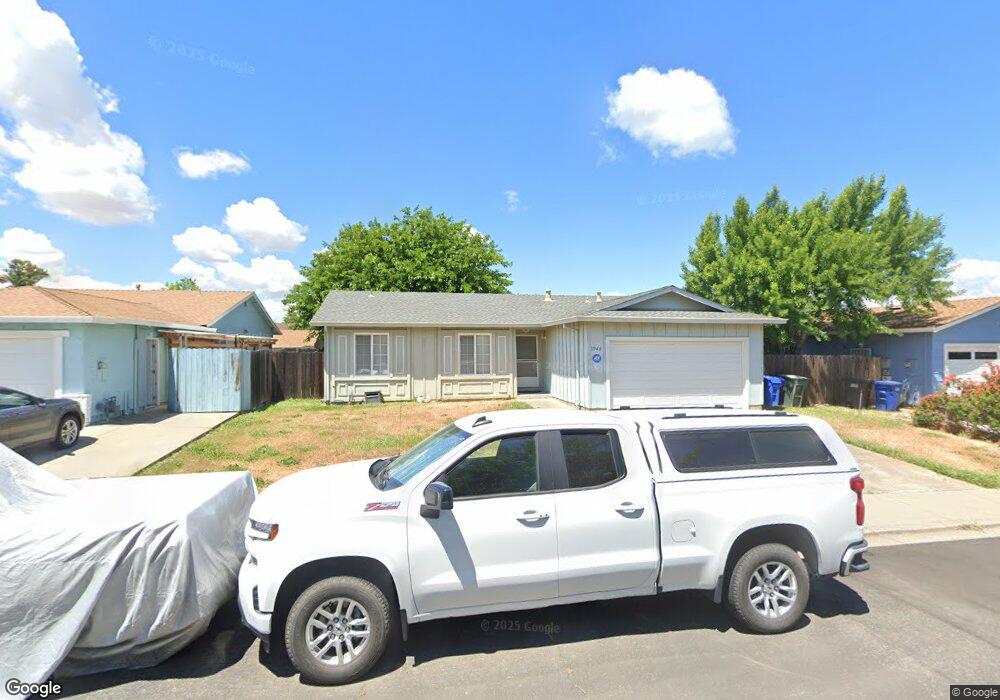
3940 Highgate Way Pittsburg, CA 94565
Meadowbrook NeighborhoodEstimated Value: $480,334 - $531,000
3
Beds
1
Bath
992
Sq Ft
$505/Sq Ft
Est. Value
About This Home
This home is located at 3940 Highgate Way, Pittsburg, CA 94565 and is currently estimated at $500,834, approximately $504 per square foot. 3940 Highgate Way is a home located in Contra Costa County with nearby schools including Stoneman Elementary School, Hillview Junior High School, and Pittsburg Senior High School.
Ownership History
Date
Name
Owned For
Owner Type
Purchase Details
Closed on
Dec 10, 2009
Sold by
Tracy Patrick W
Bought by
Tracy Patrick W
Current Estimated Value
Purchase Details
Closed on
Jan 25, 2001
Sold by
Tracy Patrick W
Bought by
Tracy Patrick W
Home Financials for this Owner
Home Financials are based on the most recent Mortgage that was taken out on this home.
Original Mortgage
$166,000
Outstanding Balance
$61,441
Interest Rate
7.41%
Mortgage Type
Purchase Money Mortgage
Estimated Equity
$439,393
Purchase Details
Closed on
Jun 26, 2000
Sold by
Cerf Alan R and Cerf Lila S
Bought by
Tracy Patrick W
Home Financials for this Owner
Home Financials are based on the most recent Mortgage that was taken out on this home.
Original Mortgage
$162,950
Interest Rate
8.67%
Mortgage Type
Purchase Money Mortgage
Purchase Details
Closed on
Sep 23, 1999
Sold by
Cerf Alan R and Cerf Lila S
Bought by
Cerf Alan R and Cerf Lila S
Create a Home Valuation Report for This Property
The Home Valuation Report is an in-depth analysis detailing your home's value as well as a comparison with similar homes in the area
Home Values in the Area
Average Home Value in this Area
Purchase History
| Date | Buyer | Sale Price | Title Company |
|---|---|---|---|
| Tracy Patrick W | -- | None Available | |
| Tracy Patrick W | -- | Fidelity National Title Co | |
| Tracy Patrick W | $168,000 | Orange Coast Title Company | |
| Cerf Alan R | -- | -- |
Source: Public Records
Mortgage History
| Date | Status | Borrower | Loan Amount |
|---|---|---|---|
| Open | Tracy Patrick W | $166,000 | |
| Closed | Tracy Patrick W | $162,950 |
Source: Public Records
Tax History
| Year | Tax Paid | Tax Assessment Tax Assessment Total Assessment is a certain percentage of the fair market value that is determined by local assessors to be the total taxable value of land and additions on the property. | Land | Improvement |
|---|---|---|---|---|
| 2025 | $3,664 | $259,691 | $53,780 | $205,911 |
| 2024 | $3,534 | $254,600 | $52,726 | $201,874 |
| 2023 | $3,534 | $249,609 | $51,693 | $197,916 |
| 2022 | $3,581 | $244,716 | $50,680 | $194,036 |
| 2021 | $3,575 | $239,919 | $49,687 | $190,232 |
| 2019 | $3,404 | $232,805 | $48,214 | $184,591 |
| 2018 | $3,277 | $228,241 | $47,269 | $180,972 |
| 2017 | $3,251 | $223,767 | $46,343 | $177,424 |
| 2016 | $3,018 | $219,381 | $45,435 | $173,946 |
| 2015 | $3,155 | $216,087 | $44,753 | $171,334 |
| 2014 | $3,055 | $211,855 | $43,877 | $167,978 |
Source: Public Records
Map
Nearby Homes
- 38 Meadowbrook Ave
- 61 Meadowbrook Cir
- 16 Surf Dr
- 4221 Mcdermott Dr
- 77 Hilo Dr
- 808 Ventura Dr
- 4044 Granada Dr
- 61 Pali Way
- 141 Maui Dr
- 268 Coral Dr
- 65 Pali Way
- 210 Kona Cir
- 109 Reef Dr Unit 109
- 4225 Mcfaul Dr
- 202 Queens Way
- 131 Banyon Dr
- 189 Kona Cir
- 224 Queens Way Unit 224
- 165 Tiki Ln
- 198 Kona Cir Unit 198
- 3942 Highgate Way
- 3938 Highgate Way
- 3871 Saint Moritz Dr
- 3881 Saint Moritz Dr
- 3861 Saint Moritz Dr
- 3944 Highgate Way
- 3941 Highgate Way
- 3939 Highgate Way
- 3851 Saint Moritz Dr
- 3943 Highgate Way
- 3937 Highgate Way
- 3936 Highgate Way
- 3946 Highgate Way
- 3945 Highgate Way
- 3901 Saint Moritz Dr
- 3841 Saint Moritz Dr
- 3935 Highgate Way
- 979 Golden Leaf Way
- 978 Terry Ct
- 3947 Highgate Way
Your Personal Tour Guide
Ask me questions while you tour the home.