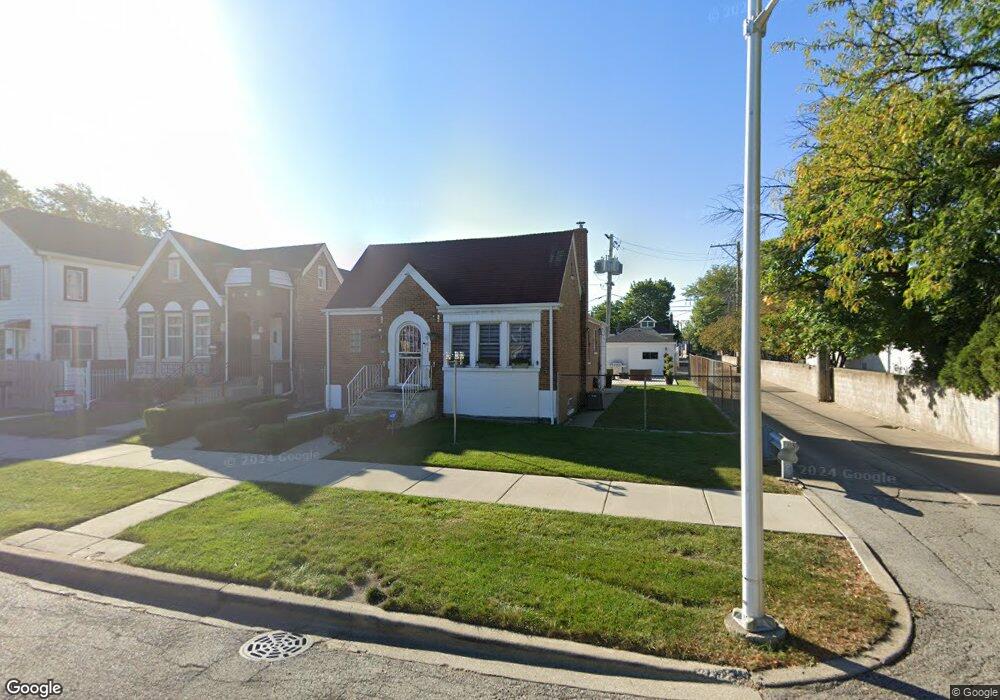
3941 W 61st St Chicago, IL 60629
West Lawn NeighborhoodEstimated Value: $213,439 - $280,000
2
Beds
1
Bath
988
Sq Ft
$251/Sq Ft
Est. Value
About This Home
This home is located at 3941 W 61st St, Chicago, IL 60629 and is currently estimated at $247,610, approximately $250 per square foot. 3941 W 61st St is a home located in Cook County with nearby schools including Peck Elementary School, Richardson Middle School, and Hubbard High School.
Ownership History
Date
Name
Owned For
Owner Type
Purchase Details
Closed on
Jul 18, 2005
Sold by
Rodriguez Mario and Rodriguez Araceli
Bought by
Rodriguez Mario and Rodriguez Araceli
Current Estimated Value
Home Financials for this Owner
Home Financials are based on the most recent Mortgage that was taken out on this home.
Original Mortgage
$202,500
Outstanding Balance
$107,002
Interest Rate
5.85%
Mortgage Type
New Conventional
Estimated Equity
$140,608
Purchase Details
Closed on
Dec 3, 2003
Sold by
Rodriguez Mario
Bought by
Rodriguez Mario and Rodriguez Aracelis
Purchase Details
Closed on
Jul 1, 2002
Sold by
Kasprzyczak Joseph and Kasprzyczak Darlene
Bought by
Rodriguez Mario
Home Financials for this Owner
Home Financials are based on the most recent Mortgage that was taken out on this home.
Original Mortgage
$169,000
Interest Rate
9%
Create a Home Valuation Report for This Property
The Home Valuation Report is an in-depth analysis detailing your home's value as well as a comparison with similar homes in the area
Home Values in the Area
Average Home Value in this Area
Purchase History
| Date | Buyer | Sale Price | Title Company |
|---|---|---|---|
| Rodriguez Mario | -- | Commercial Land Title Ins Co | |
| Rodriguez Mario | -- | Chicago Title Insurance Comp | |
| Rodriguez Mario | $169,000 | -- |
Source: Public Records
Mortgage History
| Date | Status | Borrower | Loan Amount |
|---|---|---|---|
| Open | Rodriguez Mario | $202,500 | |
| Previous Owner | Rodriguez Mario | $169,000 |
Source: Public Records
Tax History Compared to Growth
Tax History
| Year | Tax Paid | Tax Assessment Tax Assessment Total Assessment is a certain percentage of the fair market value that is determined by local assessors to be the total taxable value of land and additions on the property. | Land | Improvement |
|---|---|---|---|---|
| 2024 | $886 | $7,913 | $2,480 | $5,433 |
| 2023 | $857 | $5,170 | $1,267 | $3,903 |
| 2022 | $857 | $5,170 | $1,267 | $3,903 |
| 2021 | $839 | $5,170 | $1,267 | $3,903 |
| 2020 | $1,054 | $5,633 | $3,100 | $2,533 |
| 2019 | $1,060 | $6,271 | $3,110 | $3,161 |
| 2018 | $1,042 | $6,271 | $3,110 | $3,161 |
| 2017 | $1,041 | $5,817 | $2,799 | $3,018 |
| 2016 | $1,022 | $5,817 | $2,799 | $3,018 |
| 2015 | $928 | $5,817 | $2,799 | $3,018 |
| 2014 | $930 | $5,747 | $2,643 | $3,104 |
| 2013 | $909 | $5,747 | $2,643 | $3,104 |
Source: Public Records
Map
Nearby Homes
- 3909 W 60th Place
- 3817 W 61st Place
- 3817 W 61st St
- 6235 S Komensky Ave
- 3914 W 63rd St Unit 3B
- 6235 S Kedvale Ave
- 4015 W 59th St
- 3745 W 59th Place
- 3912 W 59th St
- 3710 W 60th Place
- 3700 W 63rd St
- 3751 W 63rd Place
- 3709 W 59th Place
- 3904 W 58th Place
- 5921 S Keeler Ave
- 6148 S Tripp Ave
- 5834 S Keeler Ave
- 4158 W 58th Place Unit 4158
- 3617 W 63rd Place
- 6200 S Kolin Ave Unit 1
- 3941 W 61st St
- 3939 W 61st St
- 3935 W 61st St
- 3931 W 61st St
- 3942 W 61st Place
- 3940 W 61st Place
- 3938 W 61st Place
- 3929 W 61st St
- 3936 W 61st Place
- 3934 W 61st Place
- 3942 W 61st St
- 3930 W 61st Place
- 3944 W 61st St
- 3940 W 61st St
- 3921 W 61st St
- 3921 W 61st St
- 3948 W 61st St
- 3936 W 61st St
- 3928 W 61st Place
- 3952 W 61st St