3942 Centralia St Lakewood, CA 90712
Lakewood Mutual NeighborhoodEstimated Value: $851,000 - $987,000
3
Beds
1
Bath
1,173
Sq Ft
$779/Sq Ft
Est. Value
About This Home
This home is located at 3942 Centralia St, Lakewood, CA 90712 and is currently estimated at $913,431, approximately $778 per square foot. 3942 Centralia St is a home located in Los Angeles County with nearby schools including Riley Elementary School, Hoover Middle School, and Lakewood High School.
Ownership History
Date
Name
Owned For
Owner Type
Purchase Details
Closed on
Feb 4, 2022
Sold by
Ward Dennis R
Bought by
Dm Ward Trust
Current Estimated Value
Purchase Details
Closed on
Nov 9, 2001
Sold by
Ward Michele Denise
Bought by
Ward Dennis R
Home Financials for this Owner
Home Financials are based on the most recent Mortgage that was taken out on this home.
Original Mortgage
$195,920
Interest Rate
6.57%
Purchase Details
Closed on
Nov 1, 2001
Sold by
Quatrone Larry John
Bought by
Ward Dennis R
Home Financials for this Owner
Home Financials are based on the most recent Mortgage that was taken out on this home.
Original Mortgage
$195,920
Interest Rate
6.57%
Purchase Details
Closed on
May 21, 1997
Sold by
Quatrone Larry J
Bought by
Quatrone Larry John and The Larry J Quatrone Family Trust
Create a Home Valuation Report for This Property
The Home Valuation Report is an in-depth analysis detailing your home's value as well as a comparison with similar homes in the area
Home Values in the Area
Average Home Value in this Area
Purchase History
| Date | Buyer | Sale Price | Title Company |
|---|---|---|---|
| Dm Ward Trust | -- | Oc Wills And Trust Attorneys | |
| Ward Dennis R | -- | Gateway Title | |
| Ward Dennis R | $245,000 | Gateway Title | |
| Quatrone Larry John | -- | -- |
Source: Public Records
Mortgage History
| Date | Status | Borrower | Loan Amount |
|---|---|---|---|
| Previous Owner | Ward Dennis R | $195,920 | |
| Closed | Ward Dennis R | $48,980 |
Source: Public Records
Tax History Compared to Growth
Tax History
| Year | Tax Paid | Tax Assessment Tax Assessment Total Assessment is a certain percentage of the fair market value that is determined by local assessors to be the total taxable value of land and additions on the property. | Land | Improvement |
|---|---|---|---|---|
| 2025 | $4,903 | $361,767 | $277,574 | $84,193 |
| 2024 | $4,903 | $354,675 | $272,132 | $82,543 |
| 2023 | $4,819 | $347,722 | $266,797 | $80,925 |
| 2022 | $4,534 | $340,905 | $261,566 | $79,339 |
| 2021 | $4,441 | $334,222 | $256,438 | $77,784 |
| 2019 | $4,374 | $324,311 | $248,833 | $75,478 |
| 2018 | $4,203 | $317,953 | $243,954 | $73,999 |
| 2016 | $3,869 | $305,609 | $234,482 | $71,127 |
| 2015 | $3,721 | $301,019 | $230,960 | $70,059 |
| 2014 | $3,696 | $295,123 | $226,436 | $68,687 |
Source: Public Records
Map
Nearby Homes
- 3638 Sandwood St
- 4532 Pepperwood Ave
- 4520 Pepperwood Ave
- 4121 Country Club Dr
- 4740 Pepperwood Ave
- 4848 Oliva Ave
- 4704 E Centralia St
- 4808 Graywood Ave
- 4944 Coke Ave
- 3244 Centralia St
- 4851 Faculty Ave
- 4826 Faculty Ave
- 4559 Levelside Ave
- 2912 Allred St
- 2803 Frankel St
- 2729 Greentop St
- 2922 Eckleson St
- 2912 Yearling St
- 4839 Premiere Ave
- 2523 Allred St
- 3936 Centralia St
- 3948 Centralia St
- 3933 Fairman St
- 3930 Centralia St
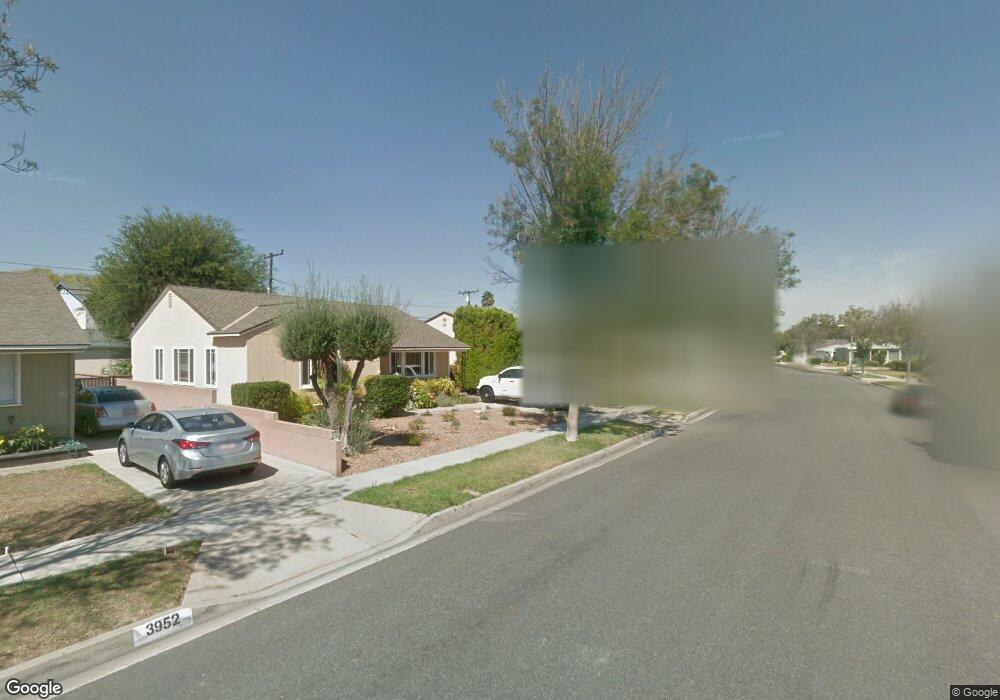
- 3952 Centralia St
- 3937 Fairman St
- 3927 Fairman St
- 3941 Fairman St
- 3926 Centralia St
- 3958 Centralia St
- 3943 Centralia St
- 3921 Fairman St
- 3947 Centralia St
- 3937 Centralia St
- 3920 Elsa St
- 3947 Fairman St
- 3953 Centralia St
- 3917 Fairman St
- 3920 Centralia St
- 4002 Centralia St