N
Seller's Agent in 2016
Nia Knowles
Area West Realty, LLC.
26 Total Sales
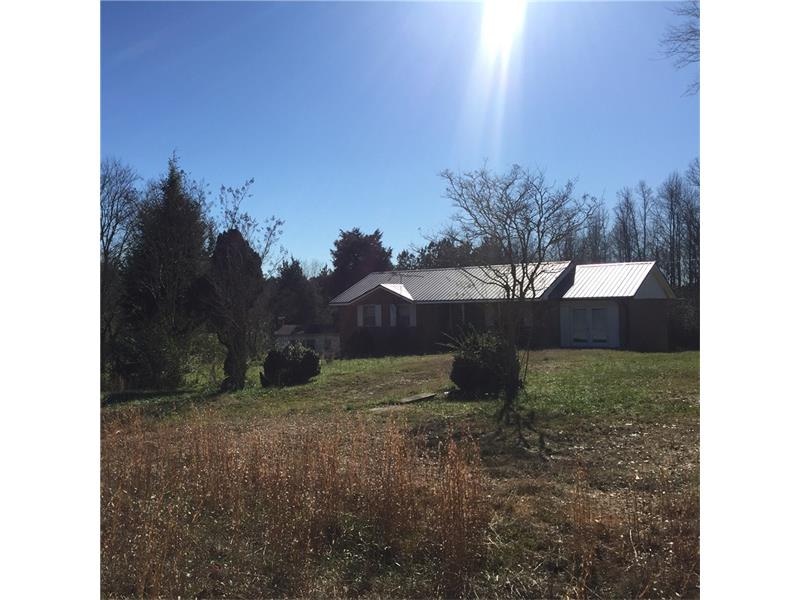
Estimated Value: $203,751 - $309,000
Home sold AS-IS, great investment lot for tear down and rebuild or rental property. No Disclosure
Last Agent to Sell the Property
Area West Realty, LLC. License #325529 Listed on: 01/02/2016
Last Buyer's Agent
Steven Smith
NOT A VALID MEMBER License #362033
| Date | Buyer | Sale Price | Title Company |
|---|---|---|---|
| Bennett James S | $28,000 | -- | |
| Bennett James S | $6,000 | -- | |
| Tucker | -- | -- |
| Date | Event | Price | List to Sale | Price per Sq Ft |
|---|---|---|---|---|
| 02/05/2016 02/05/16 | Sold | $28,000 | -12.5% | $27 / Sq Ft |
| 01/20/2016 01/20/16 | Pending | -- | -- | -- |
| 01/02/2016 01/02/16 | For Sale | $32,000 | -- | $31 / Sq Ft |
| Year | Tax Paid | Tax Assessment Tax Assessment Total Assessment is a certain percentage of the fair market value that is determined by local assessors to be the total taxable value of land and additions on the property. | Land | Improvement |
|---|---|---|---|---|
| 2024 | $1,475 | $65,194 | $6,061 | $59,133 |
| 2023 | $1,475 | $58,738 | $4,849 | $53,889 |
| 2022 | $1,168 | $46,560 | $3,233 | $43,327 |
| 2021 | $1,019 | $39,758 | $2,586 | $37,172 |
| 2020 | $918 | $35,750 | $2,351 | $33,399 |
| 2019 | $852 | $32,923 | $2,351 | $30,572 |
| 2018 | $746 | $28,410 | $2,197 | $26,213 |
| 2017 | $748 | $28,410 | $2,197 | $26,213 |
| 2016 | $749 | $28,410 | $2,197 | $26,213 |
| 2015 | $413 | $14,764 | $1,970 | $12,794 |
| 2014 | $57 | $14,764 | $1,970 | $12,794 |
N
Seller's Agent in 2016
Nia Knowles
Area West Realty, LLC.
26 Total Sales
S
Buyer's Agent in 2016
Steven Smith
NOT A VALID MEMBER
Source: First Multiple Listing Service (FMLS)
MLS Number: 5631093
APN: 032-0017
Disclaimer: Certain information contained herein is derived from information provided by parties other than Homes.com. All information provided is deemed reliable, but is not guaranteed to be accurate and should be independently verified.
![]() Listings identified with the FMLS IDX logo come from FMLS and are held by brokerage firms other than the owner of this website. The listing brokerage is identified in any listing details. Information is deemed reliable but is not guaranteed. If you believe any FMLS listing contains material that infringes your copyrighted work please visit www.fmls.com/dmca to review our DMCA policy and learn how to submit a takedown request. © 2025 First Multiple Listing Service, Inc.
Listings identified with the FMLS IDX logo come from FMLS and are held by brokerage firms other than the owner of this website. The listing brokerage is identified in any listing details. Information is deemed reliable but is not guaranteed. If you believe any FMLS listing contains material that infringes your copyrighted work please visit www.fmls.com/dmca to review our DMCA policy and learn how to submit a takedown request. © 2025 First Multiple Listing Service, Inc.
