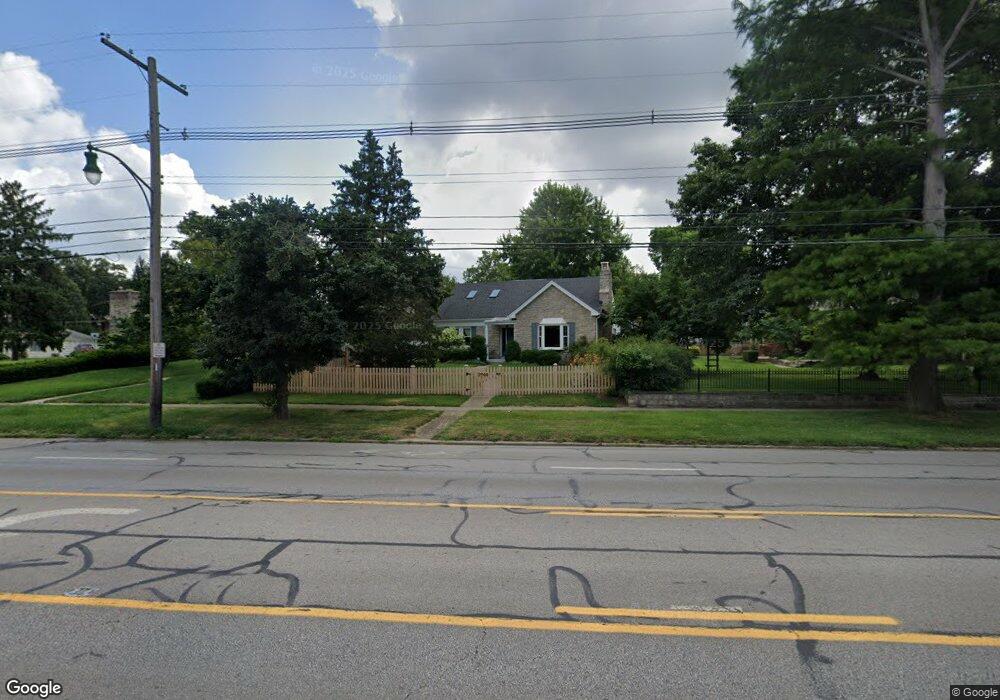
3944 N High St Columbus, OH 43214
Clintonville NeighborhoodEstimated Value: $526,422 - $600,000
3
Beds
4
Baths
1,935
Sq Ft
$286/Sq Ft
Est. Value
About This Home
This home is located at 3944 N High St, Columbus, OH 43214 and is currently estimated at $552,606, approximately $285 per square foot. 3944 N High St is a home located in Franklin County with nearby schools including Indian Springs Elementary School, Dominion Middle School, and Whetstone High School.
Ownership History
Date
Name
Owned For
Owner Type
Purchase Details
Closed on
Jan 28, 2016
Sold by
Koechlin Kathleen M and Kathleen M Koechlin Trust
Bought by
Koechlin Kathleen M
Current Estimated Value
Purchase Details
Closed on
Dec 21, 2009
Sold by
Koechlin Kathleen M
Bought by
Koechlin Kathleen M and The Kathleen M Koechlin Trust
Purchase Details
Closed on
Apr 28, 2006
Sold by
Potter Green Barb
Bought by
Koechlin Kathleen M
Home Financials for this Owner
Home Financials are based on the most recent Mortgage that was taken out on this home.
Original Mortgage
$214,007
Interest Rate
6.37%
Mortgage Type
Fannie Mae Freddie Mac
Purchase Details
Closed on
Feb 28, 2001
Sold by
Jones Alice M F and Jones Ernestine
Bought by
Green Barb Potter
Create a Home Valuation Report for This Property
The Home Valuation Report is an in-depth analysis detailing your home's value as well as a comparison with similar homes in the area
Home Values in the Area
Average Home Value in this Area
Purchase History
| Date | Buyer | Sale Price | Title Company |
|---|---|---|---|
| Koechlin Kathleen M | -- | None Available | |
| Koechlin Kathleen M | -- | Attorney | |
| Koechlin Kathleen M | $267,600 | Northwest T | |
| Green Barb Potter | $175,000 | Chicago Title |
Source: Public Records
Mortgage History
| Date | Status | Borrower | Loan Amount |
|---|---|---|---|
| Previous Owner | Koechlin Kathleen M | $214,007 |
Source: Public Records
Tax History
| Year | Tax Paid | Tax Assessment Tax Assessment Total Assessment is a certain percentage of the fair market value that is determined by local assessors to be the total taxable value of land and additions on the property. | Land | Improvement |
|---|---|---|---|---|
| 2025 | $6,612 | $147,320 | $58,240 | $89,080 |
| 2024 | $6,612 | $147,320 | $58,240 | $89,080 |
| 2023 | $6,564 | $148,155 | $58,240 | $89,915 |
| 2022 | $6,617 | $127,580 | $40,220 | $87,360 |
| 2021 | $6,629 | $127,580 | $40,220 | $87,360 |
| 2020 | $6,637 | $127,580 | $40,220 | $87,360 |
| 2019 | $6,930 | $114,240 | $30,940 | $83,300 |
| 2018 | $5,721 | $114,240 | $30,940 | $83,300 |
| 2017 | $5,956 | $114,240 | $30,940 | $83,300 |
| 2016 | $4,986 | $75,260 | $30,630 | $44,630 |
| 2015 | $4,526 | $75,260 | $30,630 | $44,630 |
| 2014 | $4,537 | $75,260 | $30,630 | $44,630 |
| 2013 | $2,238 | $75,250 | $30,625 | $44,625 |
Source: Public Records
Map
Nearby Homes
- 126 Erie Rd
- 136 Fallis Rd
- 170 Winthrop Rd
- 316 Acton Rd
- 30 E Torrence Rd
- 348 Acton Rd
- 373 Northridge Rd
- 374 Acton Rd
- 139 Aldrich Rd
- 116 E Dunedin Rd
- 243 E Schreyer Place
- 109 W Schreyer Place
- 205 W Henderson Rd
- 151 W Dominion Blvd
- 485 Fallis Rd
- 263 W North Broadway St
- 575 Acton Rd
- 325 Starrett Ct
- 367 E Dunedin Rd
- 211 Garrett Place
- 3950 N High St
- 10 Chatham Rd
- 3960 N High St
- 21 Northridge Rd
- 20 Chatham Rd
- 31 Northridge Rd
- 3914 N High St
- 10 Northridge Rd
- 28 Chatham Rd
- 37 Northridge Rd
- 22 Northridge Rd
- 36 Chatham Rd
- 43 Northridge Rd
- 3982 N High St
- 26 Northridge Rd
- 34 Northridge Rd
- 25 Chatham Rd
- 42 Chatham Rd
- 51 Northridge Rd
- 3988 N High St
Your Personal Tour Guide
Ask me questions while you tour the home.