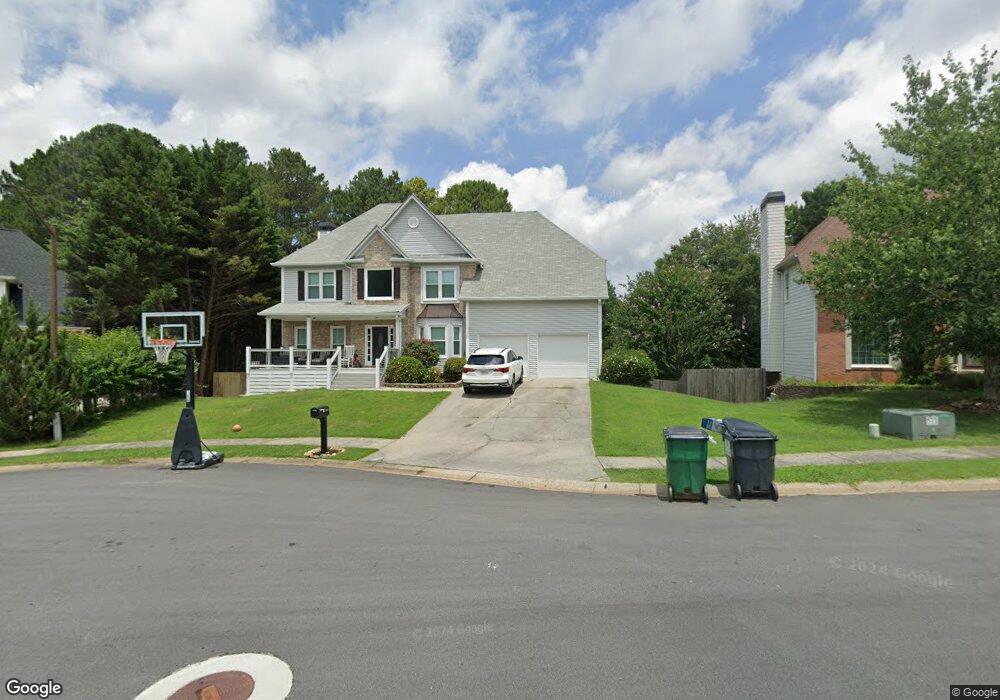
3944 Remington Way Marietta, GA 30066
Sandy Plains NeighborhoodEstimated Value: $571,424 - $682,000
6
Beds
5
Baths
2,706
Sq Ft
$235/Sq Ft
Est. Value
About This Home
This home is located at 3944 Remington Way, Marietta, GA 30066 and is currently estimated at $636,106, approximately $235 per square foot. 3944 Remington Way is a home located in Cobb County with nearby schools including Rocky Mount Elementary School, Mabry Middle School, and Lassiter High School.
Ownership History
Date
Name
Owned For
Owner Type
Purchase Details
Closed on
Nov 30, 2020
Sold by
Waid Ryan R and Waid Nicole A
Bought by
Waid Ryan R and Waid Nicole
Current Estimated Value
Home Financials for this Owner
Home Financials are based on the most recent Mortgage that was taken out on this home.
Original Mortgage
$219,000
Outstanding Balance
$158,185
Interest Rate
2.8%
Mortgage Type
New Conventional
Estimated Equity
$477,921
Purchase Details
Closed on
Sep 14, 2012
Sold by
Waid Ryan R
Bought by
Waid Ryan R and Minor Nicole A
Home Financials for this Owner
Home Financials are based on the most recent Mortgage that was taken out on this home.
Original Mortgage
$162,640
Interest Rate
3.68%
Mortgage Type
New Conventional
Purchase Details
Closed on
Jul 3, 2012
Sold by
Vanvantassell Nicholas Van
Bought by
Waid James Ajr
Purchase Details
Closed on
Nov 15, 1995
Sold by
Jv Rar
Bought by
Vantassell Arcelia
Create a Home Valuation Report for This Property
The Home Valuation Report is an in-depth analysis detailing your home's value as well as a comparison with similar homes in the area
Home Values in the Area
Average Home Value in this Area
Purchase History
| Date | Buyer | Sale Price | Title Company |
|---|---|---|---|
| Waid Ryan R | -- | None Available | |
| Waid Ryan R | -- | -- | |
| Waid James Ajr | $165,000 | -- | |
| Vantassell Arcelia | $192,400 | -- |
Source: Public Records
Mortgage History
| Date | Status | Borrower | Loan Amount |
|---|---|---|---|
| Open | Waid Ryan R | $219,000 | |
| Closed | Waid Ryan R | $162,640 | |
| Closed | Vantassell Arcelia | $0 |
Source: Public Records
Tax History Compared to Growth
Tax History
| Year | Tax Paid | Tax Assessment Tax Assessment Total Assessment is a certain percentage of the fair market value that is determined by local assessors to be the total taxable value of land and additions on the property. | Land | Improvement |
|---|---|---|---|---|
| 2025 | $5,991 | $253,564 | $48,000 | $205,564 |
| 2024 | $4,568 | $187,708 | $38,000 | $149,708 |
| 2023 | $4,025 | $187,708 | $38,000 | $149,708 |
| 2022 | $4,603 | $187,708 | $38,000 | $149,708 |
| 2021 | $3,840 | $152,820 | $30,000 | $122,820 |
| 2020 | $3,840 | $152,820 | $30,000 | $122,820 |
| 2019 | $3,840 | $152,820 | $30,000 | $122,820 |
| 2018 | $3,215 | $124,276 | $30,000 | $94,276 |
| 2017 | $3,090 | $124,276 | $30,000 | $94,276 |
| 2016 | $2,611 | $102,380 | $22,000 | $80,380 |
| 2015 | $1,683 | $65,976 | $12,416 | $53,560 |
| 2014 | $1,698 | $65,976 | $0 | $0 |
Source: Public Records
Map
Nearby Homes
- 4499 Browning Ct NE
- 4509 N Landing Dr
- 2603 Chadwick Rd
- 4509 N Bay Ct
- 2610 Chadwick Rd
- 4709 Trickum Rd NE
- 2402 Woodbridge Dr
- 4056 Longford Dr NE
- 4592 N Landing Dr
- 4314 Keheley Lake Ct NE
- 1765 Blackwillow Dr
- 4797 North Trail
- 4281 Keheley Lake Dr NE
- 4799 North Trail
- 4050 Idlewilde Meadows Dr NE
- 2256 Turtle Club Dr NE Unit 1
- 3950 Remington Way
- 3940 Remington Way
- 3947 Remington Way
- 3947 Remington Way Unit A
- 3947 NW Remington Unit A
- 3936 Remington Way
- 3937 Remington Way
- 3941 Remington Way
- 3932 Remington Way
- 0 Remington Way Unit 7114978
- 3925 Remington Way
- 3905 Remington Way
- 3928 Remington Way
- 4422 Trickum Rd NE
- 3901 Remington Way
- 3917 Remington Way
- 4446 Trickum Rd NE Unit 6A
- 3902 Remington Way
- 3924 Remington Way
- 2251 Remington Ct NE