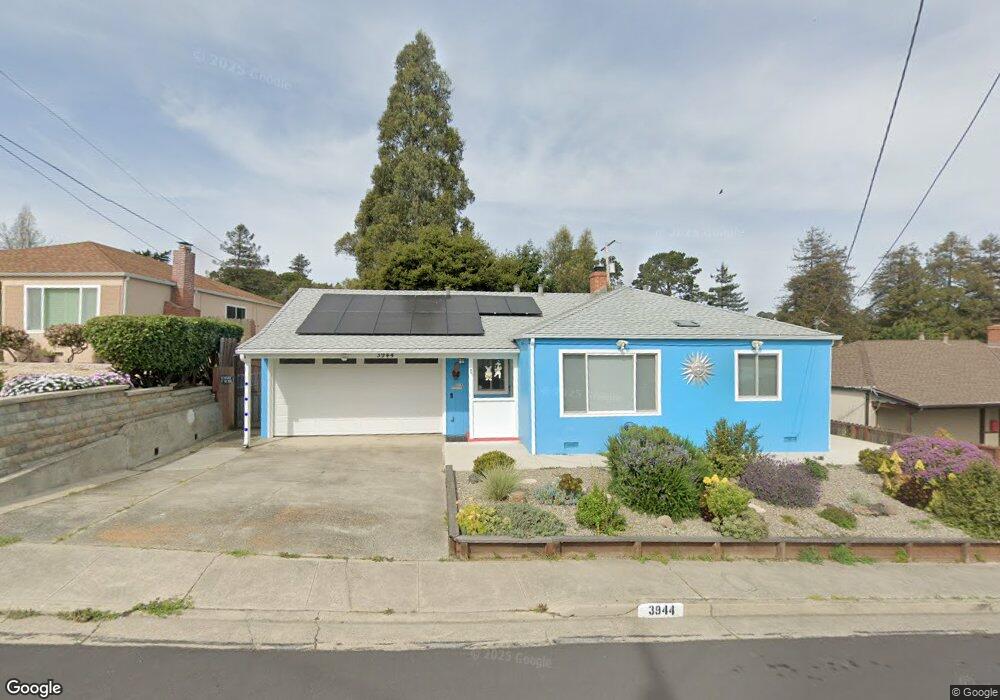
3944 Wesley Way El Sobrante, CA 94803
Estimated Value: $564,445 - $651,000
3
Beds
1
Bath
1,031
Sq Ft
$582/Sq Ft
Est. Value
About This Home
This home is located at 3944 Wesley Way, El Sobrante, CA 94803 and is currently estimated at $599,611, approximately $581 per square foot. 3944 Wesley Way is a home located in Contra Costa County with nearby schools including Sheldon Elementary School, Betty Reid Soskin Middle School, and De Anza Senior High School.
Ownership History
Date
Name
Owned For
Owner Type
Purchase Details
Closed on
Mar 7, 2016
Sold by
Preece Rachel C
Bought by
Simon Rezendes Beverly J and Simon Rezendes Denise C
Current Estimated Value
Home Financials for this Owner
Home Financials are based on the most recent Mortgage that was taken out on this home.
Original Mortgage
$215,000
Outstanding Balance
$170,959
Interest Rate
3.79%
Mortgage Type
New Conventional
Estimated Equity
$428,652
Purchase Details
Closed on
Nov 19, 2007
Sold by
Preece Rachel C
Bought by
Preece Rachel C
Purchase Details
Closed on
Mar 3, 2006
Sold by
Nisen Dolores Ruth and Nisen Peter J
Bought by
Preece Rachel C
Home Financials for this Owner
Home Financials are based on the most recent Mortgage that was taken out on this home.
Original Mortgage
$200,000
Interest Rate
6.08%
Mortgage Type
Fannie Mae Freddie Mac
Create a Home Valuation Report for This Property
The Home Valuation Report is an in-depth analysis detailing your home's value as well as a comparison with similar homes in the area
Home Values in the Area
Average Home Value in this Area
Purchase History
| Date | Buyer | Sale Price | Title Company |
|---|---|---|---|
| Simon Rezendes Beverly J | $430,000 | Old Republic Title Company | |
| Preece Rachel C | -- | None Available | |
| Preece Rachel C | $485,000 | Old Republic Title Company |
Source: Public Records
Mortgage History
| Date | Status | Borrower | Loan Amount |
|---|---|---|---|
| Open | Simon Rezendes Beverly J | $215,000 | |
| Previous Owner | Preece Rachel C | $200,000 |
Source: Public Records
Tax History
| Year | Tax Paid | Tax Assessment Tax Assessment Total Assessment is a certain percentage of the fair market value that is determined by local assessors to be the total taxable value of land and additions on the property. | Land | Improvement |
|---|---|---|---|---|
| 2025 | $7,734 | $509,027 | $355,136 | $153,891 |
| 2024 | $7,395 | $499,047 | $348,173 | $150,874 |
| 2023 | $7,395 | $489,263 | $341,347 | $147,916 |
| 2022 | $7,292 | $479,670 | $334,654 | $145,016 |
| 2021 | $7,261 | $470,266 | $328,093 | $142,173 |
| 2019 | $6,853 | $456,319 | $318,362 | $137,957 |
| 2018 | $6,591 | $447,372 | $312,120 | $135,252 |
| 2017 | $6,434 | $438,600 | $306,000 | $132,600 |
| 2016 | $6,357 | $430,000 | $336,910 | $93,090 |
| 2015 | $4,851 | $310,000 | $242,889 | $67,111 |
| 2014 | $4,312 | $266,500 | $208,805 | $57,695 |
Source: Public Records
Map
Nearby Homes
- 4363 Wesley Way
- 4441 Jana Vista Rd
- 4242 Fariss Ln
- 4556 Appian Way Unit 36
- 39 Quail Hill Ln
- 2185 Greenridge Dr
- 3760 Via Verdi
- 3764 Via Verdi Unit 13
- 4740 Appian Way Unit 9
- 557 Chabre Ct
- 4265 San Pablo Dam Rd
- 121 Creekside Ct
- 130 Creekside Ct
- 742 La Paloma Rd
- 3005 De Anza Dr
- 4778 Hilltop Dr Unit 1
- 0 Barth Ave
- 4708 Westwood Ct
- 205 Del Valle Cir
- 677 Renfrew Rd
- 3938 Wesley Way
- 3956 Wesley Way
- 3926 Wesley Way
- 3964 Wesley Way
- 4211 Harmon Rd
- 3949 Wesley Way
- 3929 Wesley Way
- 4221 Harmon Rd
- 3976 Wesley Way
- 3920 Wesley Way
- 4007 Wesley Way Unit 1
- 3871 Wesley Way
- 4231 Harmon Rd
- 3950 Milton Dr
- 3940 Milton Dr
- 4000 Wesley Way
- 4210 Harmon Rd
- 3930 Milton Dr
- 3914 Wesley Way
- 4241 Harmon Rd
Your Personal Tour Guide
Ask me questions while you tour the home.