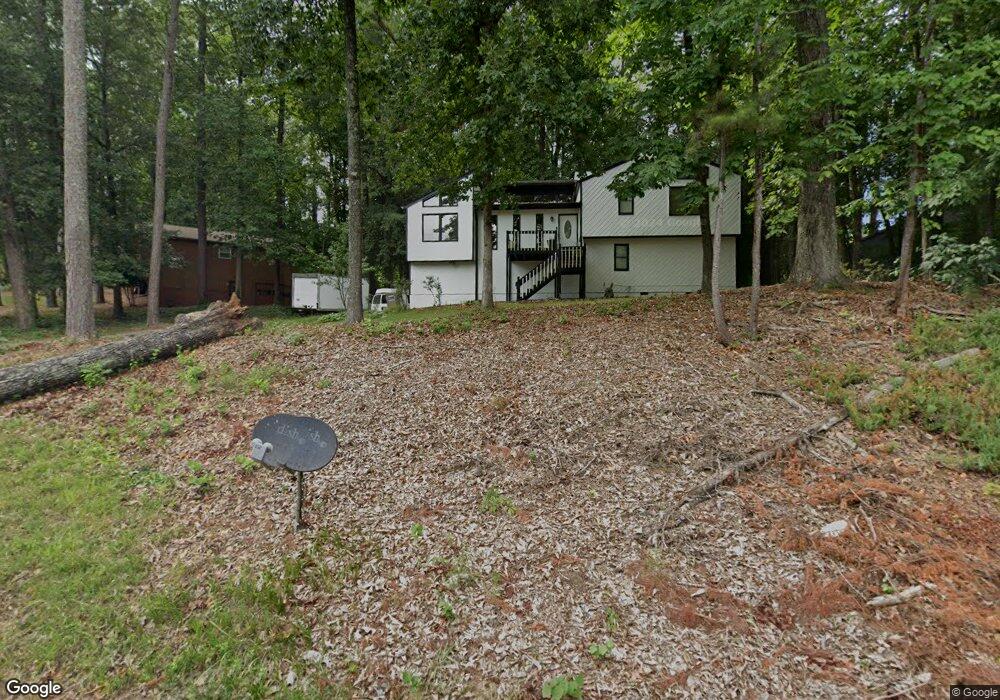
3945 Fairington Dr Unit 2 Marietta, GA 30066
Sandy Plains NeighborhoodEstimated Value: $359,000 - $418,742
4
Beds
3
Baths
1,586
Sq Ft
$244/Sq Ft
Est. Value
About This Home
This home is located at 3945 Fairington Dr Unit 2, Marietta, GA 30066 and is currently estimated at $387,186, approximately $244 per square foot. 3945 Fairington Dr Unit 2 is a home located in Cobb County with nearby schools including Blackwell Elementary School, Daniell Middle School, and Sprayberry High School.
Ownership History
Date
Name
Owned For
Owner Type
Purchase Details
Closed on
Oct 21, 2011
Sold by
Citimortgage Inc
Bought by
Perez Ana F
Current Estimated Value
Purchase Details
Closed on
Sep 6, 2011
Sold by
Spearman Robert L
Bought by
Citimortgage Inc
Purchase Details
Closed on
Apr 15, 2011
Sold by
Spearman Robert L and Spearman Della P
Bought by
Spearman Living Trust
Purchase Details
Closed on
Jul 14, 2010
Sold by
Spearman Robert L and Spearman Della P
Bought by
Kummers Karl
Purchase Details
Closed on
Jun 25, 1999
Sold by
Tran Van T
Bought by
Spearmen Robert L and Spearmen Della P
Home Financials for this Owner
Home Financials are based on the most recent Mortgage that was taken out on this home.
Original Mortgage
$127,512
Interest Rate
7.27%
Mortgage Type
New Conventional
Purchase Details
Closed on
Jan 25, 1999
Sold by
Robinson Natasha P
Bought by
Tran Van T
Create a Home Valuation Report for This Property
The Home Valuation Report is an in-depth analysis detailing your home's value as well as a comparison with similar homes in the area
Home Values in the Area
Average Home Value in this Area
Purchase History
| Date | Buyer | Sale Price | Title Company |
|---|---|---|---|
| Perez Ana F | $63,000 | -- | |
| Citimortgage Inc | $73,613 | -- | |
| Spearman Living Trust | -- | -- | |
| Spearman Living Trust | -- | -- | |
| Kummers Karl | -- | -- | |
| Kummer Karl | -- | -- | |
| Spearmen Robert L | $127,000 | -- | |
| Tran Van T | -- | -- |
Source: Public Records
Mortgage History
| Date | Status | Borrower | Loan Amount |
|---|---|---|---|
| Previous Owner | Spearmen Robert L | $127,512 |
Source: Public Records
Tax History Compared to Growth
Tax History
| Year | Tax Paid | Tax Assessment Tax Assessment Total Assessment is a certain percentage of the fair market value that is determined by local assessors to be the total taxable value of land and additions on the property. | Land | Improvement |
|---|---|---|---|---|
| 2024 | $4,622 | $153,316 | $34,000 | $119,316 |
| 2023 | $4,003 | $132,772 | $34,000 | $98,772 |
| 2022 | $3,609 | $118,928 | $22,000 | $96,928 |
| 2021 | $2,870 | $94,564 | $22,000 | $72,564 |
| 2020 | $2,363 | $77,856 | $16,000 | $61,856 |
| 2019 | $2,185 | $72,008 | $16,000 | $56,008 |
| 2018 | $1,811 | $59,668 | $16,000 | $43,668 |
| 2017 | $1,427 | $49,644 | $10,000 | $39,644 |
| 2016 | $1,427 | $49,644 | $10,000 | $39,644 |
| 2015 | $1,463 | $49,644 | $10,000 | $39,644 |
| 2014 | $748 | $25,192 | $0 | $0 |
Source: Public Records
Map
Nearby Homes
- 3924 Devonshire Dr
- 3776 Westchase Dr
- 3978 Devonshire Dr
- 589 Whisperwill Dr
- 651 Charing Cross Dr
- 3674 Canton Rd
- 3819 Courson St
- 570 Charing Cross Dr
- 336 Nottingham Dr
- 3909 Bellair Dr
- 750 Alison Jane Ct NE
- 3920 Bellair Dr
- 671 Glenbarrett Ct NE Unit IV
- 1053 Swaying Pines Trace
- 529 Hawkins Store Rd NE
- 3418 Chastain Glen Ln NE
- 4108 Christacy Way
- 3927 Fairington Dr
- 3951 Fairington Dr
- 3943 Viewpoint Ct
- 3948 Fairington Dr
- 3957 Fairington Dr
- 3932 Fairington Dr
- 3944 Fairington Dr Unit 2
- 3923 Fairington Dr Unit 2
- 3942 Lookout Point Dr
- 3944 Viewpoint Ct
- 3926 Fairington Dr Unit 2
- 3946 Lookout Point Dr Unit 3
- 3956 Fairington Dr
- 3963 Fairington Dr
- 3920 Fairington Dr
- 3947 Viewpoint Ct
- 3950 Lookout Point Dr
- 3941 Kensington Dr
- 3931 Kensington Dr Unit 1
- 3951 Kensington Dr