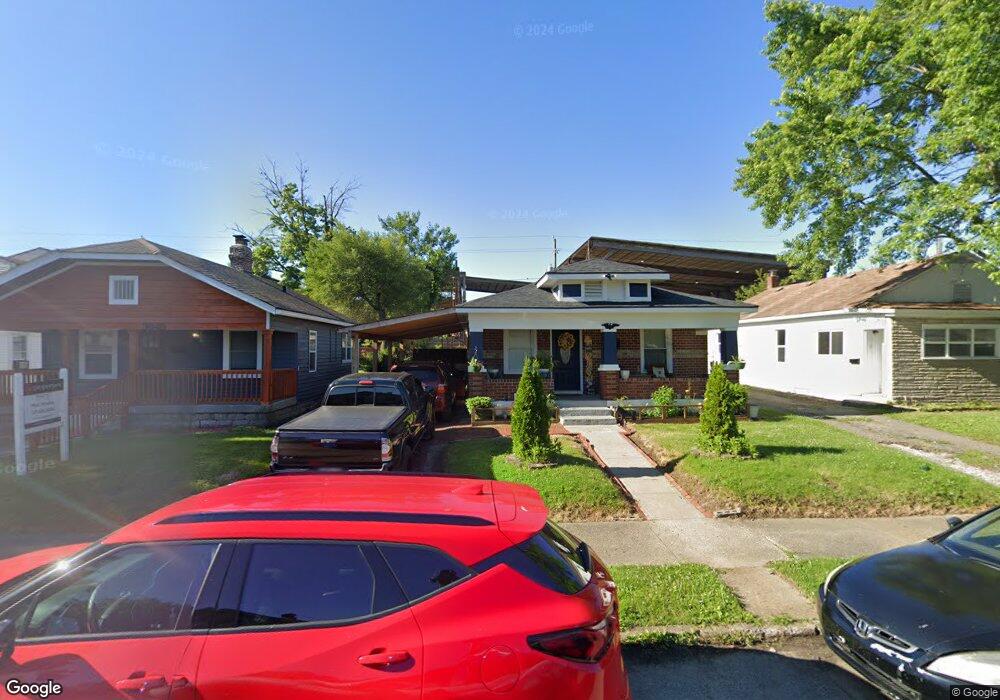
3945 Hoyt Ave Indianapolis, IN 46203
Christian Park NeighborhoodEstimated Value: $130,000 - $147,000
2
Beds
1
Bath
804
Sq Ft
$172/Sq Ft
Est. Value
About This Home
This home is located at 3945 Hoyt Ave, Indianapolis, IN 46203 and is currently estimated at $138,260, approximately $171 per square foot. 3945 Hoyt Ave is a home located in Marion County with nearby schools including Ralph Waldo Emerson School 58, Eleanor Skillen School No. 34, and Christian Park School 82.
Ownership History
Date
Name
Owned For
Owner Type
Purchase Details
Closed on
Jan 11, 2007
Sold by
Swartz & Brough Inc
Bought by
Chinchilla Leonel
Current Estimated Value
Home Financials for this Owner
Home Financials are based on the most recent Mortgage that was taken out on this home.
Original Mortgage
$18,900
Interest Rate
6.21%
Mortgage Type
Purchase Money Mortgage
Purchase Details
Closed on
Aug 26, 2006
Sold by
Fannie Mae
Bought by
Swartz Brough Inc
Purchase Details
Closed on
Mar 29, 2006
Sold by
Washington Mutual Bank
Bought by
Federal National Mortgage Association
Purchase Details
Closed on
Mar 28, 2006
Sold by
Clark Violet F and Collazo Sharon E
Bought by
Washington Mutual Bank and North American Mortgage Co
Purchase Details
Closed on
May 19, 2005
Sold by
Clark Violet F
Bought by
Collazo Sharon E
Create a Home Valuation Report for This Property
The Home Valuation Report is an in-depth analysis detailing your home's value as well as a comparison with similar homes in the area
Home Values in the Area
Average Home Value in this Area
Purchase History
| Date | Buyer | Sale Price | Title Company |
|---|---|---|---|
| Chinchilla Leonel | -- | None Available | |
| Swartz Brough Inc | -- | None Available | |
| Federal National Mortgage Association | -- | None Available | |
| Washington Mutual Bank | $46,966 | None Available | |
| Collazo Sharon E | -- | None Available |
Source: Public Records
Mortgage History
| Date | Status | Borrower | Loan Amount |
|---|---|---|---|
| Previous Owner | Chinchilla Leonel | $18,900 |
Source: Public Records
Tax History Compared to Growth
Tax History
| Year | Tax Paid | Tax Assessment Tax Assessment Total Assessment is a certain percentage of the fair market value that is determined by local assessors to be the total taxable value of land and additions on the property. | Land | Improvement |
|---|---|---|---|---|
| 2024 | $562 | $78,200 | $10,300 | $67,900 |
| 2023 | $562 | $72,700 | $10,300 | $62,400 |
| 2022 | $521 | $72,700 | $10,300 | $62,400 |
| 2021 | $424 | $56,400 | $10,300 | $46,100 |
| 2020 | $374 | $50,200 | $4,500 | $45,700 |
| 2019 | $341 | $45,600 | $4,500 | $41,100 |
| 2018 | $308 | $40,600 | $4,500 | $36,100 |
| 2017 | $247 | $36,100 | $4,500 | $31,600 |
| 2016 | $201 | $30,700 | $4,500 | $26,200 |
| 2014 | $153 | $32,500 | $4,500 | $28,000 |
| 2013 | $189 | $37,300 | $4,500 | $32,800 |
Source: Public Records
Map
Nearby Homes
- 3949 Fletcher Ave
- 3909 Hoyt Ave
- 3907 Hoyt Ave
- 3901 Hoyt Ave
- 3847 Hoyt Ave
- 3949 English Ave
- 4339 Spann Ave
- 416 S Denny St
- 659 Temperance Ave
- 533 Temperance Ave
- 3750 Prospect St
- 3618 Spann Ave
- 545 Dayton Ave
- 1159 S Bradley Ave
- 1214 S Chester Ave
- 610 Prospect St
- 267 S Grant Ave
- 264 S Grant Ave
- 4136 E Pleasant Run Parkway North Dr
- 3519 E Morris St