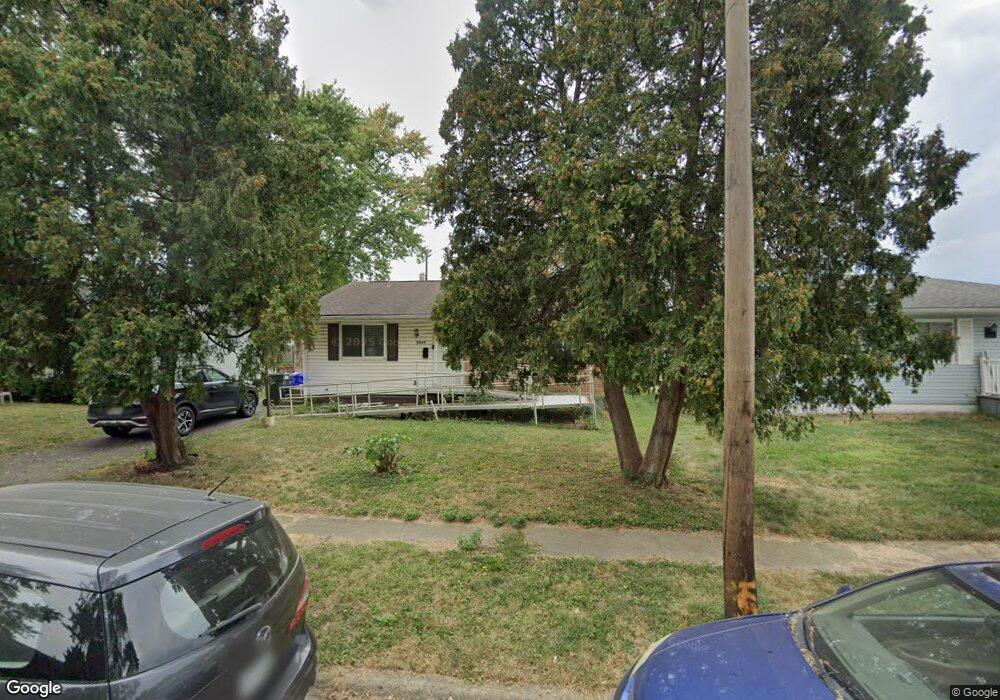
3945 Ivorton Rd E Columbus, OH 43207
Obetz-Lockbourne NeighborhoodEstimated Value: $162,467 - $186,000
3
Beds
1
Bath
896
Sq Ft
$197/Sq Ft
Est. Value
About This Home
This home is located at 3945 Ivorton Rd E, Columbus, OH 43207 and is currently estimated at $176,367, approximately $196 per square foot. 3945 Ivorton Rd E is a home located in Franklin County with nearby schools including Cedarwood Alternative Elementary School @ Stockbri, Buckeye Middle School, and Marion-Franklin High School.
Ownership History
Date
Name
Owned For
Owner Type
Purchase Details
Closed on
Nov 9, 2006
Sold by
Fox Chris
Bought by
Balcarcel Richard W
Current Estimated Value
Home Financials for this Owner
Home Financials are based on the most recent Mortgage that was taken out on this home.
Original Mortgage
$82,650
Outstanding Balance
$48,332
Interest Rate
6.38%
Mortgage Type
Purchase Money Mortgage
Estimated Equity
$128,035
Purchase Details
Closed on
Jul 17, 2006
Sold by
Deutsche Bank National Trust Co
Bought by
Fox Chris
Purchase Details
Closed on
May 31, 2006
Sold by
Fannin Donna M and Case #05Cve07 7232
Bought by
Deutsche Bank National Trust Co
Purchase Details
Closed on
Jun 2, 1992
Bought by
Fannin Donna M
Purchase Details
Closed on
Dec 18, 1990
Purchase Details
Closed on
Aug 16, 1990
Create a Home Valuation Report for This Property
The Home Valuation Report is an in-depth analysis detailing your home's value as well as a comparison with similar homes in the area
Home Values in the Area
Average Home Value in this Area
Purchase History
| Date | Buyer | Sale Price | Title Company |
|---|---|---|---|
| Balcarcel Richard W | $82,700 | Land & Mo | |
| Fox Chris | $52,000 | Accutitle | |
| Deutsche Bank National Trust Co | $52,000 | None Available | |
| Fannin Donna M | $55,000 | -- | |
| -- | -- | -- | |
| -- | $36,000 | -- |
Source: Public Records
Mortgage History
| Date | Status | Borrower | Loan Amount |
|---|---|---|---|
| Open | Balcarcel Richard W | $82,650 |
Source: Public Records
Tax History
| Year | Tax Paid | Tax Assessment Tax Assessment Total Assessment is a certain percentage of the fair market value that is determined by local assessors to be the total taxable value of land and additions on the property. | Land | Improvement |
|---|---|---|---|---|
| 2025 | $1,907 | $42,490 | $12,250 | $30,240 |
| 2024 | $1,907 | $42,490 | $12,250 | $30,240 |
| 2023 | $1,883 | $42,490 | $12,250 | $30,240 |
| 2022 | $1,525 | $29,400 | $8,050 | $21,350 |
| 2021 | $1,799 | $29,400 | $8,050 | $21,350 |
| 2020 | $1,530 | $29,400 | $8,050 | $21,350 |
| 2019 | $1,586 | $26,150 | $7,000 | $19,150 |
| 2018 | $1,491 | $26,150 | $7,000 | $19,150 |
| 2017 | $1,563 | $26,150 | $7,000 | $19,150 |
| 2016 | $1,540 | $23,250 | $5,010 | $18,240 |
| 2015 | $1,398 | $23,250 | $5,010 | $18,240 |
| 2014 | $1,402 | $23,250 | $5,010 | $18,240 |
| 2013 | $726 | $24,430 | $5,250 | $19,180 |
Source: Public Records
Map
Nearby Homes
- 812 Breathitt Ave
- 662 Bartfield Dr
- 904 Kyle Ave
- 3757 Amwell Rd W
- 3735 Christie Rd W
- 3785 S Ohio Ave
- 577 Barcher Rd
- 3691 Ferman Rd
- 0 Parsons Ave Unit 225012522
- 484 Cedarwood Rd
- 692 Tinkers Creek Ln
- 895 Robmeyer Dr
- 3714 Parsons Ave
- 525 Ashwood Rd
- 503 Ashwood Rd
- 369 Chatterly Ln
- 4141 Kershaw Dr
- 1062 Viewpointe Dr
- 4132 Martinsburg Dr
- 1101 Meadow Ln
- 3953 Ivorton Rd E
- 3939 Ivorton Rd E
- 3959 Ivorton Rd E
- 3931 Ivorton Rd E
- 3936 Ivorton Rd W
- 3942 Ivorton Rd W
- 3928 Ivorton Rd W
- 3950 Ivorton Rd W
- 3920 Ivorton Rd W
- 3923 Ivorton Rd E
- 748 Ivorton Rd S
- 3944 Ivorton Rd E
- 3952 Ivorton Rd E
- 3938 Ivorton Rd E
- 3962 Ivorton Rd E
- 3930 Ivorton Rd E
- 3914 Ivorton Rd W
- 3917 Ivorton Rd E
- 3960 Ivorton Rd W
- 3922 Ivorton Rd E