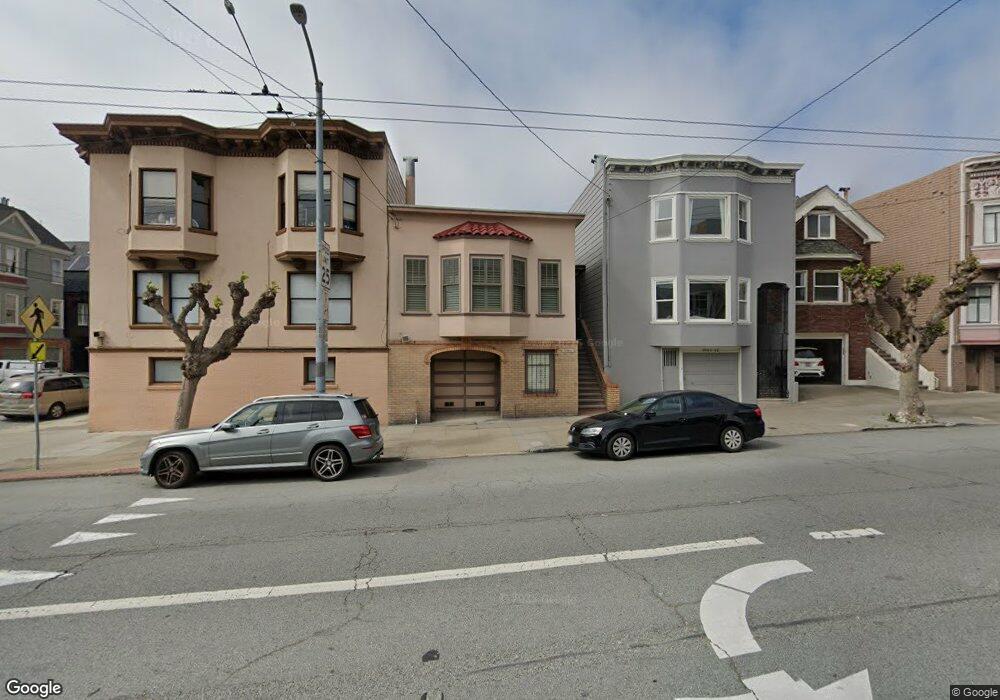
3946 California St San Francisco, CA 94118
Lake Street NeighborhoodEstimated Value: $2,266,000 - $3,120,000
3
Beds
2
Baths
1,840
Sq Ft
$1,378/Sq Ft
Est. Value
About This Home
This home is located at 3946 California St, San Francisco, CA 94118 and is currently estimated at $2,536,235, approximately $1,378 per square foot. 3946 California St is a home located in San Francisco County with nearby schools including Sutro Elementary School, Roosevelt Middle School, and Presidio Hill School.
Ownership History
Date
Name
Owned For
Owner Type
Purchase Details
Closed on
Apr 3, 2021
Sold by
Chan Toshiko Grace
Bought by
Chan Toshiko Grace and The George & Toshiko Chan 2014
Current Estimated Value
Purchase Details
Closed on
Feb 11, 2021
Sold by
Natsume John Kazuo
Bought by
Natsume John K and The John K Natsume 2007 Revoca
Purchase Details
Closed on
Apr 22, 2017
Sold by
Natsume Larry Hitoshi
Bought by
Natsume Larry Hitoshi and Natsume Revocable Trust Agreem
Purchase Details
Closed on
Dec 6, 2016
Sold by
Kunioka Hiroko Kawano and Kunioka Hiroko
Bought by
Kunioka Weis Laura M and The Hiroko Kunioko Irrevocable
Purchase Details
Closed on
Jul 13, 2016
Sold by
Chan Toshiko Grace
Bought by
Chan Toshiko Grace and The George & Toshiko Chan 2014
Purchase Details
Closed on
May 23, 2016
Sold by
Glaze Mariko Ruby
Bought by
Chan Toshiko Grace and Kunioka Hiroko
Purchase Details
Closed on
Aug 26, 2015
Sold by
Chan Toshiko Grace and The Monkichi & Misuye Natsume
Bought by
Glaze Mariko Ruby and Chan Toshiko Grace
Create a Home Valuation Report for This Property
The Home Valuation Report is an in-depth analysis detailing your home's value as well as a comparison with similar homes in the area
Home Values in the Area
Average Home Value in this Area
Purchase History
| Date | Buyer | Sale Price | Title Company |
|---|---|---|---|
| Chan Toshiko Grace | -- | None Available | |
| Natsume John K | -- | None Available | |
| Natsume Larry Hitoshi | -- | None Available | |
| Kunioka Weis Laura M | -- | None Available | |
| Chan Toshiko Grace | -- | None Available | |
| Chan Toshiko Grace | -- | None Available | |
| Glaze Mariko Ruby | -- | None Available |
Source: Public Records
Tax History Compared to Growth
Tax History
| Year | Tax Paid | Tax Assessment Tax Assessment Total Assessment is a certain percentage of the fair market value that is determined by local assessors to be the total taxable value of land and additions on the property. | Land | Improvement |
|---|---|---|---|---|
| 2025 | $10,619 | $922,091 | $573,094 | $348,997 |
| 2024 | $10,619 | $904,021 | $561,860 | $342,161 |
| 2023 | $10,467 | $886,311 | $550,847 | $335,464 |
| 2022 | $5,856 | $486,953 | $255,597 | $231,356 |
| 2021 | $5,673 | $477,405 | $250,585 | $226,820 |
| 2020 | $6,369 | $472,525 | $248,020 | $224,505 |
| 2019 | $5,401 | $448,280 | $243,165 | $205,115 |
| 2018 | $4,894 | $360,760 | $238,180 | $122,580 |
| 2017 | $1,025 | $77,988 | $37,704 | $40,284 |
| 2016 | $981 | $76,464 | $36,966 | $39,498 |
| 2015 | $889 | $75,500 | $36,502 | $38,998 |
| 2014 | $1,125 | $74,022 | $35,787 | $38,235 |
Source: Public Records
Map
Nearby Homes
- 130 2nd Ave
- 3975 Clay St
- 38 Presidio Terrace
- 3 Presidio Terrace
- 3234 Clement St
- 116 Cherry St
- 236 6th Ave Unit 238
- 334-336 4th Ave
- 120 7th Ave
- 3657 California St
- 56-58 Parker Ave
- 185 7th Ave
- 371 6th Ave
- 373 6th Ave
- 432 4th Ave
- 622 Spruce St
- 474 2nd Ave
- 4328 Geary Blvd
- 374 376 Funston Ave
- 3515 Sacramento St
- 3940 California St
- 3934 California St
- 146 2nd Ave
- 150 2nd Ave
- 3932 California St
- 3930 California St
- 142 2nd Ave Unit 144
- 3922 California St Unit 3924
- 138 2nd Ave Unit 140
- 4000 California St
- 134 2nd Ave
- 145 2nd Ave
- 4006 California St Unit 4010
- 132 2nd Ave
- 255 Arguello Blvd Unit 257
- 128 2nd Ave
- 3921 California St
- 3923 California St Unit 2
- 3923 California St Unit 1
- 251 Arguello Blvd Unit 253