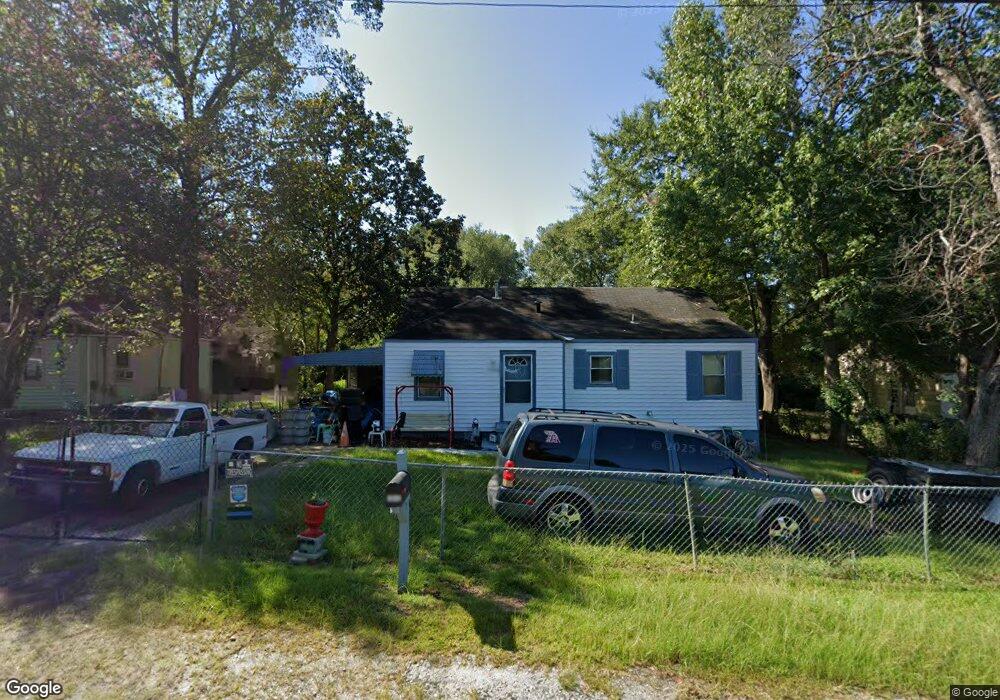
3946 Linden Cir Columbus, GA 31907
Eastern Columbus NeighborhoodEstimated Value: $79,000 - $93,000
3
Beds
3
Baths
1,104
Sq Ft
$80/Sq Ft
Est. Value
About This Home
This home is located at 3946 Linden Cir, Columbus, GA 31907 and is currently estimated at $87,952, approximately $79 per square foot. 3946 Linden Cir is a home located in Muscogee County with nearby schools including Lonnie Jackson Academy, Rothschild Leadership Academy, and Kendrick High School.
Ownership History
Date
Name
Owned For
Owner Type
Purchase Details
Closed on
Feb 11, 2013
Sold by
The Sec Of Veterans
Bought by
Hall James Kenneth
Current Estimated Value
Purchase Details
Closed on
Jul 3, 2012
Sold by
Central Mtg Co
Bought by
The Sec Of Veterans Affa
Purchase Details
Closed on
Dec 9, 2008
Sold by
Gordon Valencia L
Bought by
Gordon Valencia L and Gordon Dwayne C
Home Financials for this Owner
Home Financials are based on the most recent Mortgage that was taken out on this home.
Original Mortgage
$83,047
Interest Rate
6.38%
Mortgage Type
VA
Purchase Details
Closed on
May 30, 2008
Sold by
Yasin Mohamed J
Bought by
Dumas Homer L
Home Financials for this Owner
Home Financials are based on the most recent Mortgage that was taken out on this home.
Original Mortgage
$36,000
Interest Rate
6%
Mortgage Type
Purchase Money Mortgage
Create a Home Valuation Report for This Property
The Home Valuation Report is an in-depth analysis detailing your home's value as well as a comparison with similar homes in the area
Home Values in the Area
Average Home Value in this Area
Purchase History
| Date | Buyer | Sale Price | Title Company |
|---|---|---|---|
| Hall James Kenneth | $28,000 | -- | |
| The Sec Of Veterans Affa | -- | -- | |
| Central Mtg Co | $52,878 | -- | |
| Gordon Valencia L | -- | None Available | |
| Gordon Valencia L | $84,900 | None Available | |
| Dumas Homer L | $40,000 | None Available |
Source: Public Records
Mortgage History
| Date | Status | Borrower | Loan Amount |
|---|---|---|---|
| Previous Owner | Gordon Valencia L | $83,047 | |
| Previous Owner | Gordon Valencia L | $5,000 | |
| Previous Owner | Dumas Homer L | $36,000 |
Source: Public Records
Tax History Compared to Growth
Tax History
| Year | Tax Paid | Tax Assessment Tax Assessment Total Assessment is a certain percentage of the fair market value that is determined by local assessors to be the total taxable value of land and additions on the property. | Land | Improvement |
|---|---|---|---|---|
| 2025 | $977 | $24,956 | $6,200 | $18,756 |
| 2024 | $977 | $24,956 | $6,200 | $18,756 |
| 2023 | $983 | $24,956 | $6,200 | $18,756 |
| 2022 | $828 | $20,288 | $6,200 | $14,088 |
| 2021 | $752 | $18,428 | $6,200 | $12,228 |
| 2020 | $753 | $18,428 | $6,200 | $12,228 |
| 2019 | $755 | $18,428 | $6,200 | $12,228 |
| 2018 | $755 | $18,428 | $6,200 | $12,228 |
| 2017 | $757 | $18,428 | $6,200 | $12,228 |
| 2016 | $613 | $14,856 | $1,758 | $13,098 |
| 2015 | $245 | $14,856 | $1,758 | $13,098 |
| 2014 | $550 | $33,279 | $1,758 | $31,521 |
| 2013 | -- | $33,958 | $1,758 | $32,200 |
Source: Public Records
Map
Nearby Homes
- 939 Pembrook Dr
- 809 Dogwood Dr
- 920 Ashland Ave
- 679 Parkchester Dr
- 636 Dogwood Dr
- 800 Morris Rd
- 3943 Curry St
- 1122 Woodburn Ct
- 1110 Woodburn Dr
- 3570 Stratford Dr
- 3435 Buena Vista Rd
- 776 Terminal Ct
- 3415 Terminal St
- 813 Wright Dr
- 937 Diggs Ave
- 4459 Bermuda St
- 3414 Terminal St
- 754 Wright Dr
- 3413 Terminal Ct
- 3589 Irwin Way
- 3952 Linden Cir
- 3942 Linden Cir
- 3958 Linden Cir
- 3958 Linden Cir
- 3938 Linden Cir
- 3962 Linden Cir
- 3951 Linden Cir
- 3934 Linden Cir
- 3959 Linden Cir
- 3930 Linden Cir
- 3968 Linden Cir
- 3961 Linden Cir
- 3924 Linden Cir
- 3915 Linden Cir
- 3967 Linden Cir
- 3920 Linden Cir
- 3842 N Linden Dr
- 3971 Linden Cir
- 3848 N Linden Dr
- 3916 Linden Cir