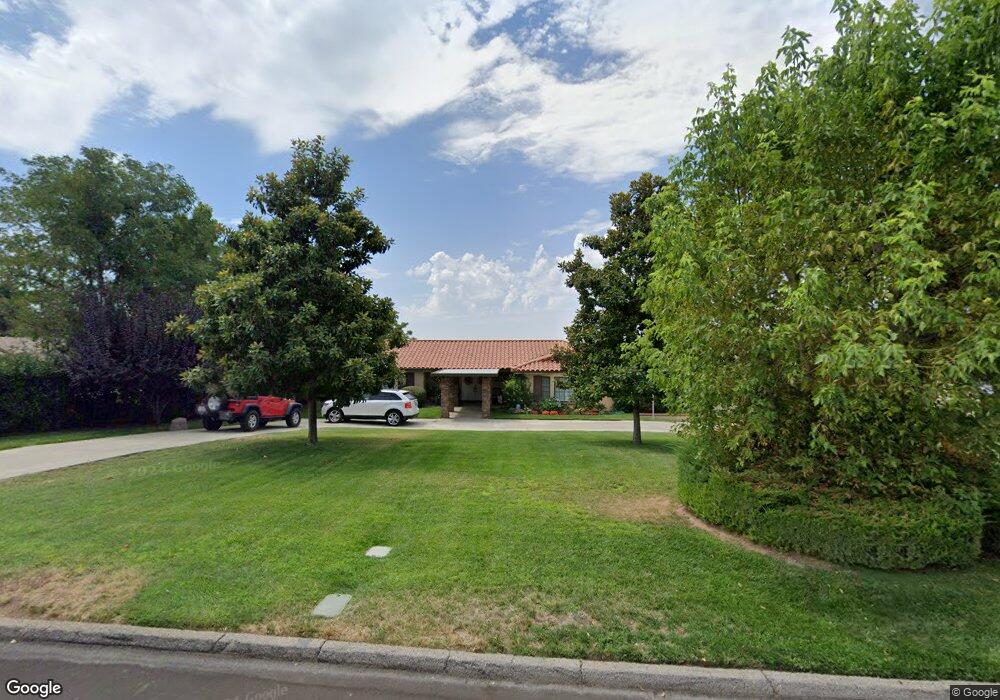
39497 Cherry Oak Rd Cherry Valley, CA 92223
Estimated Value: $791,000 - $983,199
2
Beds
3
Baths
3,247
Sq Ft
$266/Sq Ft
Est. Value
About This Home
This home is located at 39497 Cherry Oak Rd, Cherry Valley, CA 92223 and is currently estimated at $865,300, approximately $266 per square foot. 39497 Cherry Oak Rd is a home located in Riverside County with nearby schools including Brookside Elementary School, Mountain View Middle School, and Beaumont Senior High School.
Ownership History
Date
Name
Owned For
Owner Type
Purchase Details
Closed on
Aug 7, 2015
Sold by
Kelly Christopher and Kelly Georgina
Bought by
Family Trust Of Christopher Kelly & Geor
Current Estimated Value
Purchase Details
Closed on
Jul 25, 2003
Sold by
Martin Barbara H
Bought by
Kelly Christopher and Kelly Georgina
Home Financials for this Owner
Home Financials are based on the most recent Mortgage that was taken out on this home.
Original Mortgage
$319,200
Outstanding Balance
$139,180
Interest Rate
5.6%
Mortgage Type
Purchase Money Mortgage
Estimated Equity
$726,120
Purchase Details
Closed on
Mar 7, 1998
Sold by
Eveland Jo Anne
Bought by
Martin Walter H and Martin Barbara H
Home Financials for this Owner
Home Financials are based on the most recent Mortgage that was taken out on this home.
Original Mortgage
$150,000
Interest Rate
6.62%
Create a Home Valuation Report for This Property
The Home Valuation Report is an in-depth analysis detailing your home's value as well as a comparison with similar homes in the area
Home Values in the Area
Average Home Value in this Area
Purchase History
| Date | Buyer | Sale Price | Title Company |
|---|---|---|---|
| Family Trust Of Christopher Kelly & Geor | -- | None Available | |
| Kelly Christopher | $399,000 | Fidelity National Title Co | |
| Martin Walter H | $225,000 | Chicago Title Co |
Source: Public Records
Mortgage History
| Date | Status | Borrower | Loan Amount |
|---|---|---|---|
| Open | Kelly Christopher | $319,200 | |
| Previous Owner | Martin Walter H | $150,000 | |
| Closed | Kelly Christopher | $39,900 |
Source: Public Records
Tax History
| Year | Tax Paid | Tax Assessment Tax Assessment Total Assessment is a certain percentage of the fair market value that is determined by local assessors to be the total taxable value of land and additions on the property. | Land | Improvement |
|---|---|---|---|---|
| 2025 | $7,801 | $615,545 | $142,162 | $473,383 |
| 2023 | $7,801 | $591,644 | $136,643 | $455,001 |
| 2022 | $7,677 | $580,044 | $133,964 | $446,080 |
| 2021 | $7,528 | $568,672 | $131,338 | $437,334 |
| 2020 | $7,452 | $562,842 | $129,992 | $432,850 |
| 2019 | $7,334 | $551,807 | $127,444 | $424,363 |
| 2018 | $7,305 | $540,989 | $124,947 | $416,042 |
| 2017 | $7,191 | $530,383 | $122,498 | $407,885 |
| 2016 | $6,648 | $494,000 | $114,000 | $380,000 |
| 2015 | $6,217 | $463,000 | $107,000 | $356,000 |
| 2014 | $6,304 | $460,000 | $106,000 | $354,000 |
Source: Public Records
Map
Nearby Homes
- 9110 Oak Creek Rd
- 9575 Oak Glen Rd
- 0 Tokay St Unit EV22011453
- 9643 Avenida Miravilla
- 39441 Tokay St
- 39581 Cherry Oak Canyon Rd
- 39380 Oak View Ln
- 0 Bonita Dr
- 0 Cherry Valley Unit EV24091167
- 0 Avenida Miravilla
- 9710 Mountain View Ave
- 9187 Bonita Dr
- 10007 Beaumont Ave
- 1 Avenida Miravilla
- 10269 Live Oak Ave
- 39068 Vineland St
- 38608 Pass View Dr
- 38992 Vineland St
- 8705 Apple Tree Ln
- 40335 Avenida Altejo Bella
- 39521 Cherry Oak Rd
- 39473 Cherry Oak Rd
- 9465 Oak Glen Rd
- 39459 Cherry Oak Rd
- 39470 Cherry Oak Rd
- 9423 Oak Glen Rd
- 39435 Cherry Oak Rd
- 9444 Oak Glen Rd
- 9432 Oak Glen Rd
- 9491 Lakeview Ct
- 9462 Oak Glen Rd
- 39425 Cherry Oak Rd
- 9509 Oak Glen Rd
- 39430 Cherry Oak Rd
- 9416 Oak Glen Rd
- 9482 Oak Glen Rd
- 9410 Oak Glen Rd
- 39409 Cherry Oak Rd
- 39406 Cherry Oak Rd
- 9459 Lakeview Ct
Your Personal Tour Guide
Ask me questions while you tour the home.