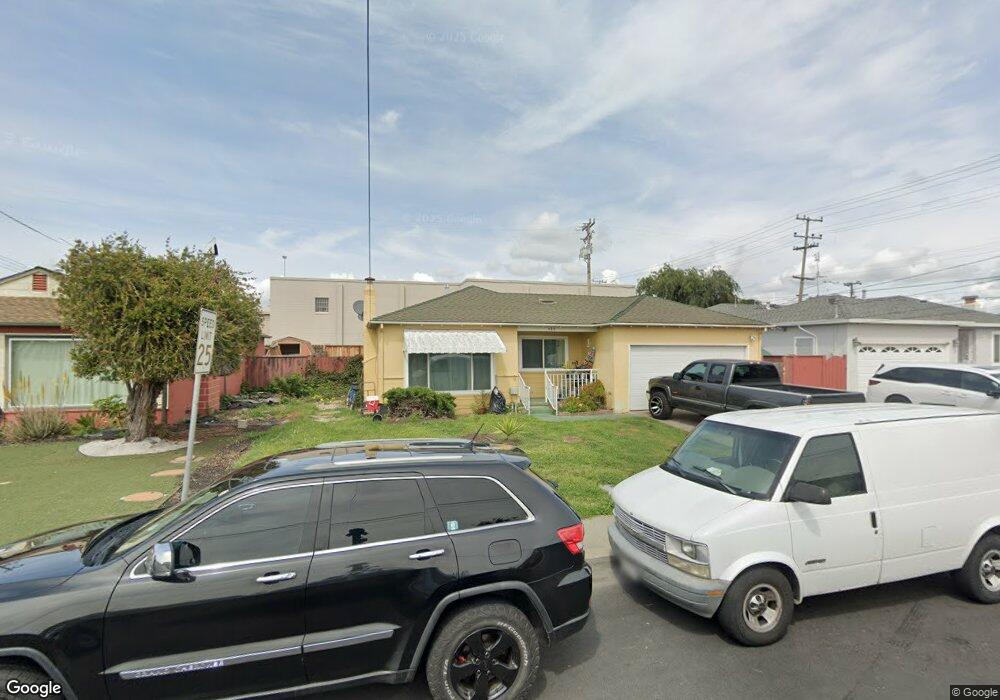
395 Anza Way San Leandro, CA 94578
Floresta Gardens-Bradrick NeighborhoodEstimated Value: $736,000 - $930,000
4
Beds
3
Baths
1,582
Sq Ft
$530/Sq Ft
Est. Value
About This Home
This home is located at 395 Anza Way, San Leandro, CA 94578 and is currently estimated at $838,614, approximately $530 per square foot. 395 Anza Way is a home located in Alameda County with nearby schools including Monroe Elementary School, John Muir Middle School, and San Leandro High School.
Ownership History
Date
Name
Owned For
Owner Type
Purchase Details
Closed on
May 20, 2010
Sold by
Pendley Steve Dudley and The Frank
Bought by
Zeng Sharon D and Zeng Richard R
Current Estimated Value
Home Financials for this Owner
Home Financials are based on the most recent Mortgage that was taken out on this home.
Original Mortgage
$180,000
Outstanding Balance
$119,816
Interest Rate
4.91%
Mortgage Type
New Conventional
Estimated Equity
$718,798
Purchase Details
Closed on
Jan 7, 2005
Sold by
Atkins Frank and Atkins Ethel
Bought by
Atkins Frank and Atkins Ethel
Home Financials for this Owner
Home Financials are based on the most recent Mortgage that was taken out on this home.
Original Mortgage
$469,342
Interest Rate
4.63%
Mortgage Type
Reverse Mortgage Home Equity Conversion Mortgage
Create a Home Valuation Report for This Property
The Home Valuation Report is an in-depth analysis detailing your home's value as well as a comparison with similar homes in the area
Home Values in the Area
Average Home Value in this Area
Purchase History
| Date | Buyer | Sale Price | Title Company |
|---|---|---|---|
| Zeng Sharon D | $380,000 | Old Republic Title Company | |
| Atkins Frank | -- | North American Title Co |
Source: Public Records
Mortgage History
| Date | Status | Borrower | Loan Amount |
|---|---|---|---|
| Open | Zeng Sharon D | $180,000 | |
| Previous Owner | Atkins Frank | $469,342 |
Source: Public Records
Tax History Compared to Growth
Tax History
| Year | Tax Paid | Tax Assessment Tax Assessment Total Assessment is a certain percentage of the fair market value that is determined by local assessors to be the total taxable value of land and additions on the property. | Land | Improvement |
|---|---|---|---|---|
| 2025 | $6,770 | $490,477 | $147,143 | $343,334 |
| 2024 | $6,770 | $480,863 | $144,259 | $336,604 |
| 2023 | $6,633 | $471,434 | $141,430 | $330,004 |
| 2022 | $6,431 | $462,193 | $138,658 | $323,535 |
| 2021 | $6,247 | $453,134 | $135,940 | $317,194 |
| 2020 | $6,093 | $448,490 | $134,547 | $313,943 |
| 2019 | $5,902 | $439,697 | $131,909 | $307,788 |
| 2018 | $5,730 | $431,078 | $129,323 | $301,755 |
| 2017 | $5,623 | $422,627 | $126,788 | $295,839 |
| 2016 | $5,320 | $414,344 | $124,303 | $290,041 |
| 2015 | $5,221 | $408,123 | $122,437 | $285,686 |
| 2014 | $5,182 | $400,131 | $120,039 | $280,092 |
Source: Public Records
Map
Nearby Homes
- 391 Anza Way
- 455 Lloyd Ave
- 15009 Kesterson St
- 365 Caliente Cir
- 688 Garside Ct
- 14828 Martell Ave
- 15049 Kesterson St
- 3847 Yorkshire St Unit 8
- 619 Beatrice St
- 3811 Yorkshire St Unit 2
- 774 Hamlin Way
- 14820 Crosby St
- 475 Nabor St
- 650 Fargo Ave Unit 4
- 700 Fargo Ave Unit 12
- 700 Fargo Ave Unit 5
- 700 Fargo Ave Unit 2
- 700 Fargo Ave Unit 1
- 3672 Del Monte Way
- 720 Fargo Ave Unit 14