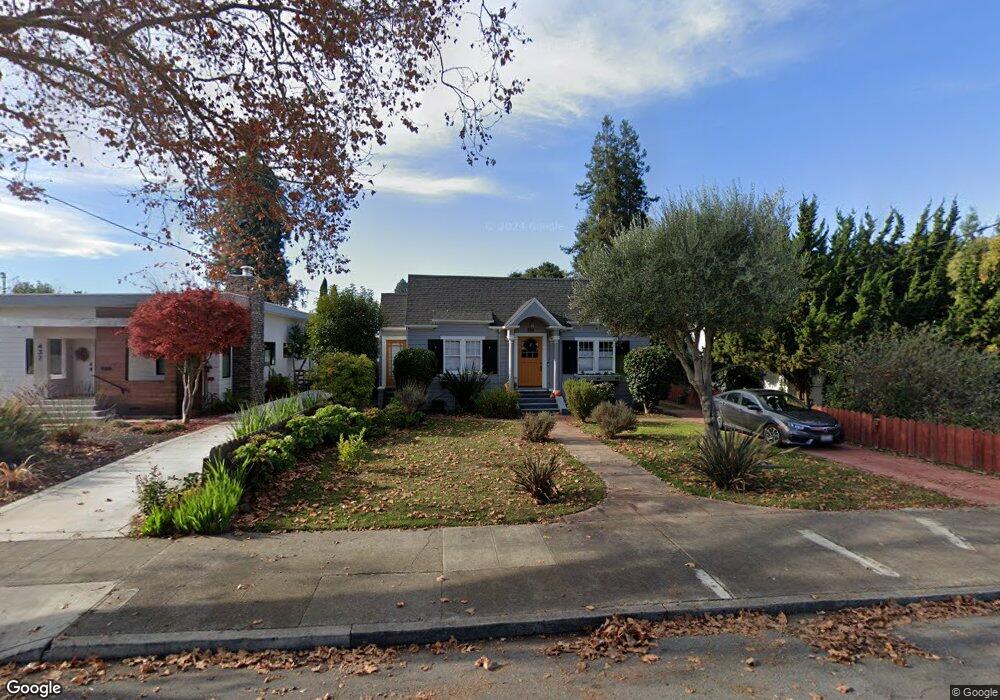
395 Beverly Ave San Leandro, CA 94577
Broadmoor District NeighborhoodEstimated Value: $1,059,816 - $1,244,000
2
Beds
2
Baths
1,561
Sq Ft
$714/Sq Ft
Est. Value
About This Home
This home is located at 395 Beverly Ave, San Leandro, CA 94577 and is currently estimated at $1,114,454, approximately $713 per square foot. 395 Beverly Ave is a home located in Alameda County with nearby schools including Washington Elementary School, Bancroft Middle School, and San Leandro High School.
Ownership History
Date
Name
Owned For
Owner Type
Purchase Details
Closed on
Feb 15, 2022
Sold by
Roberts and Anita
Bought by
Black Matthew T and Shutko Emma Fox
Current Estimated Value
Home Financials for this Owner
Home Financials are based on the most recent Mortgage that was taken out on this home.
Original Mortgage
$920,000
Outstanding Balance
$854,290
Interest Rate
3.55%
Mortgage Type
New Conventional
Estimated Equity
$260,164
Purchase Details
Closed on
Mar 5, 2002
Sold by
Roberts Robert and Gonzalez Anita
Bought by
Roberts Robert and Gonzalez Anita
Home Financials for this Owner
Home Financials are based on the most recent Mortgage that was taken out on this home.
Original Mortgage
$174,000
Interest Rate
6.94%
Purchase Details
Closed on
Feb 22, 1996
Sold by
Swan Financial Company Inc
Bought by
Roberts Robert R and Gonzalez Anita D
Home Financials for this Owner
Home Financials are based on the most recent Mortgage that was taken out on this home.
Original Mortgage
$164,250
Interest Rate
7.04%
Purchase Details
Closed on
Mar 14, 1995
Sold by
Lemke Glenda Jean and Quality Mtg Usa Inc
Bought by
Swan Financial Company Inc
Create a Home Valuation Report for This Property
The Home Valuation Report is an in-depth analysis detailing your home's value as well as a comparison with similar homes in the area
Home Values in the Area
Average Home Value in this Area
Purchase History
| Date | Buyer | Sale Price | Title Company |
|---|---|---|---|
| Black Matthew T | $1,150,000 | Chicago Title | |
| Roberts Robert | -- | First American Title Guarant | |
| Roberts Robert R | $164,500 | Fidelity National Title Ins | |
| Swan Financial Company Inc | $140,032 | -- |
Source: Public Records
Mortgage History
| Date | Status | Borrower | Loan Amount |
|---|---|---|---|
| Open | Black Matthew T | $920,000 | |
| Previous Owner | Roberts Robert | $174,000 | |
| Previous Owner | Roberts Robert R | $164,250 |
Source: Public Records
Tax History
| Year | Tax Paid | Tax Assessment Tax Assessment Total Assessment is a certain percentage of the fair market value that is determined by local assessors to be the total taxable value of land and additions on the property. | Land | Improvement |
|---|---|---|---|---|
| 2025 | $16,115 | $1,213,380 | $366,114 | $854,266 |
| 2024 | $16,115 | $1,189,460 | $358,938 | $837,522 |
| 2023 | $15,991 | $1,173,000 | $351,900 | $821,100 |
| 2022 | $4,481 | $250,031 | $77,172 | $179,859 |
| 2021 | $4,279 | $244,992 | $75,659 | $176,333 |
| 2020 | $4,102 | $249,409 | $74,883 | $174,526 |
| 2019 | $4,004 | $244,519 | $73,415 | $171,104 |
| 2018 | $3,886 | $239,726 | $71,976 | $167,750 |
| 2017 | $3,825 | $235,027 | $70,565 | $164,462 |
| 2016 | $3,647 | $230,420 | $69,182 | $161,238 |
| 2015 | $3,580 | $226,960 | $68,143 | $158,817 |
| 2014 | $3,539 | $222,514 | $66,808 | $155,706 |
Source: Public Records
Map
Nearby Homes
- 76 Georgia Way
- 235 Bancroft Ave
- 845 Woodland Ave
- 10926 Bancroft Ave
- 576 Begier Ave
- 275 Haas Ave
- 464 Kenilworth Ave
- 2139 108th Ave
- 159 Garcia Ave
- 350 Lafayette Ave
- 185 Belleview Dr
- 2174 107th Ave
- 1622 Tucker St Unit 66
- 230 Belleview Dr
- 1594 Tucker St Unit 56
- 330 Melven Ct
- 310 Melven Ct
- 10504 Voltaire Ave
- 10430 Voltaire Ave
- 356 Belleview Dr
- 377 Beverly Ave
- 437 Beverly Ave
- 441 Beverly Ave
- 367 Beverly Ave
- 445 Beverly Ave
- 398 Breed Ave
- 355 Beverly Ave
- 392 Breed Ave
- 406 Breed Ave
- 380 Breed Ave
- 416 Breed Ave
- 440 Beverly Ave
- 372 Breed Ave
- 430 Breed Ave
- 465 Beverly Ave
- 386 Beverly Ave
- 351 Beverly Ave
- 432 Beverly Ave
- 382 Beverly Ave
- 438 Beverly Ave
Your Personal Tour Guide
Ask me questions while you tour the home.